

The only reputation management industry benchmark report you need to plan your customer acquisition/retention strategies, become customer-obsessed and grow your bottom line.
The start of a new year is a great time for brands to ensure they have a solid plan in place for reputation management – a non-negotiable element of customer acquisition and retention. ReviewTrackers’ annual online reputation analysis report is an integral part of that process.
The unpredictable economic climate means that consumer wallets will be tighter than ever, and people are looking for the right signals, including brand reputation, as part of their purchase decision. By delivering on and surpassing the expectations set by a brand’s online reputation, companies make it even easier to retain customers for repeat purchases and visits, even during turbulent times.
Setting the bar for success early on can help teams create accurate, data-driven decisions that lead to long-term success and retention, even through potentially tough economic periods. The insights below give brands and their teams the ideal metrics they should be hitting achieve in order to be successful in the upcoming year.
Methodology
Industry benchmark and online reputation analysis data was gathered from a 10-month period spanning from Jan. 1, 2022 to Oct. 31, 2022. The graphs and data featured are a result of data collected from ReviewTrackers customers, plus other businesses in their competitive wave (thanks to our suite of competitive intelligence tools).
Online Reputation Analysis Part 1: The Industry Averages
The starting point for any online reputation analysis is a clear picture of the industry at-large. To get this analysis, we gathered a set of averages across multiple reputation metrics that impact online visibility easily and drive traffic to your team’s locations or franchises such as overall rating, total number of reviews, and response rate from the data set mentioned above. These data points allow brands to compare themselves to current trends as well as overall performance on a per-location basis, which help create new strategies that lead to better retention, internal operation, and overall long-term success.
We’re also including our customer experience analytics data, which uses natural language processing to make sense of unstructured data by extracting and categorizing review keywords by sentiment. When combined together, these data points reveal vital competitive intelligence data for each industry, and drive awareness to specific areas of improvement within your own team.
For instance, a collection of 100 reviews might reveal that the keyword “staff” is being mentioned often in a negative sentiment, which can direct your team’s attention to operational improvements. The same feature can also be used to gather competitive intelligence. Experience Analysis can look at a competitor’s reviews to show overwhelming negative sentiment for certain products, pricing, or even atmosphere. This type of competitive intel can be used by your team to create powerful assets that drive consumers towards your offerings and away from the competition.
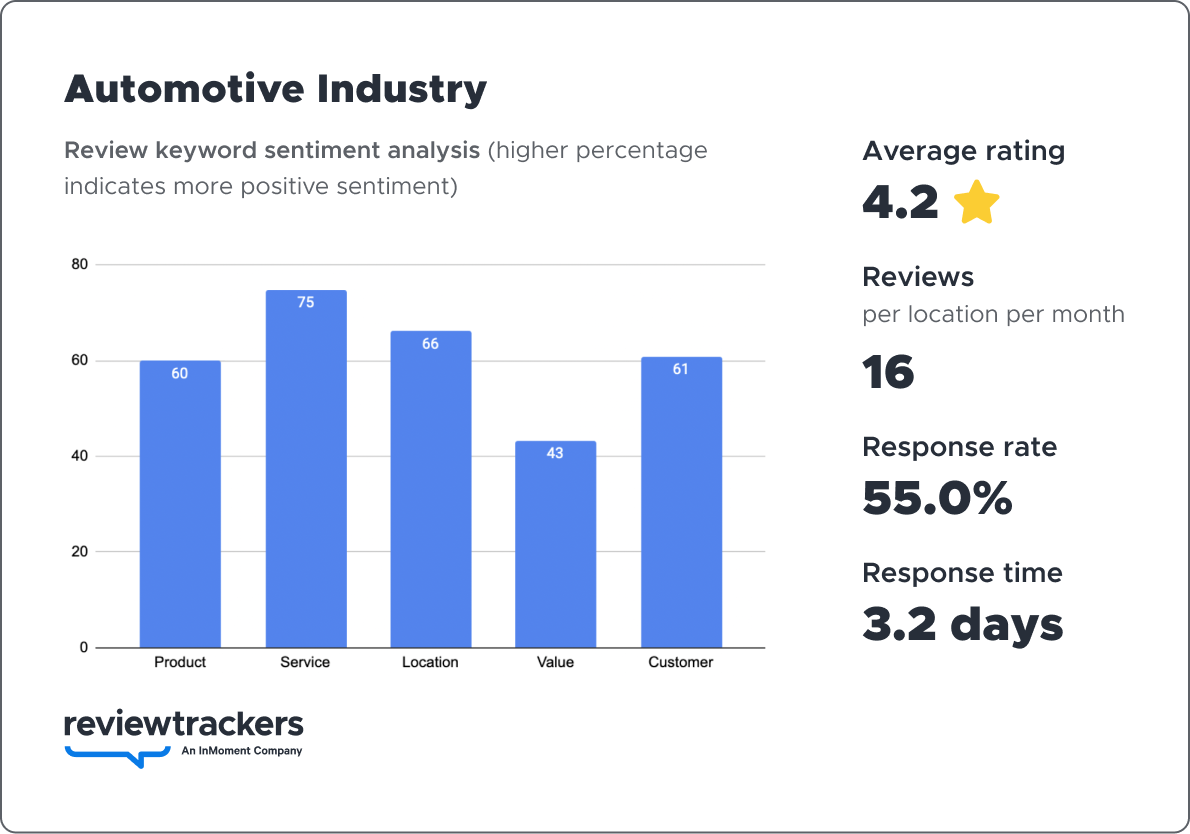
Automotive
Compared to last year’s data, the automotive industry has somewhat declined in reputation benchmarks, dipping from a 4.26 rating to 4.21. The change might seem miniscule, but not when compared with review volume. On average, the industry is losing 5 reviews per month per location compared to last year, and response rate also dropped by nearly 5%.
Despite the declining numbers, sentiment data is nearly constant, save for the slightly lower positive sentiment towards brand value and location.
Takeaways
As a whole, the automotive industry needs to do more in order to gain more reviews and loyal customers. Efforts need to be made to reach out to customers after they leave a service location or dealership with messaging that stresses the value the company and customer get from posting a review.
A strong review request can be the competitive advantage needed to overtake competitors, showing them your brand prioritizes customer feedback and improvement. Incoming reviews should also be managed immediately. With a review response plan, your team can easily impress customers and beat the competition through swift and impactful complaint resolution.
Sentiment data also shows that service is a highly-positive sentiment across reviews. Prioritizing the customer service both in practice and during the planning of the customer journey can make the purchase decision easier for consumers. Using tools like Amplify can help raise the valuable social proof needed to turn prospects into customers.
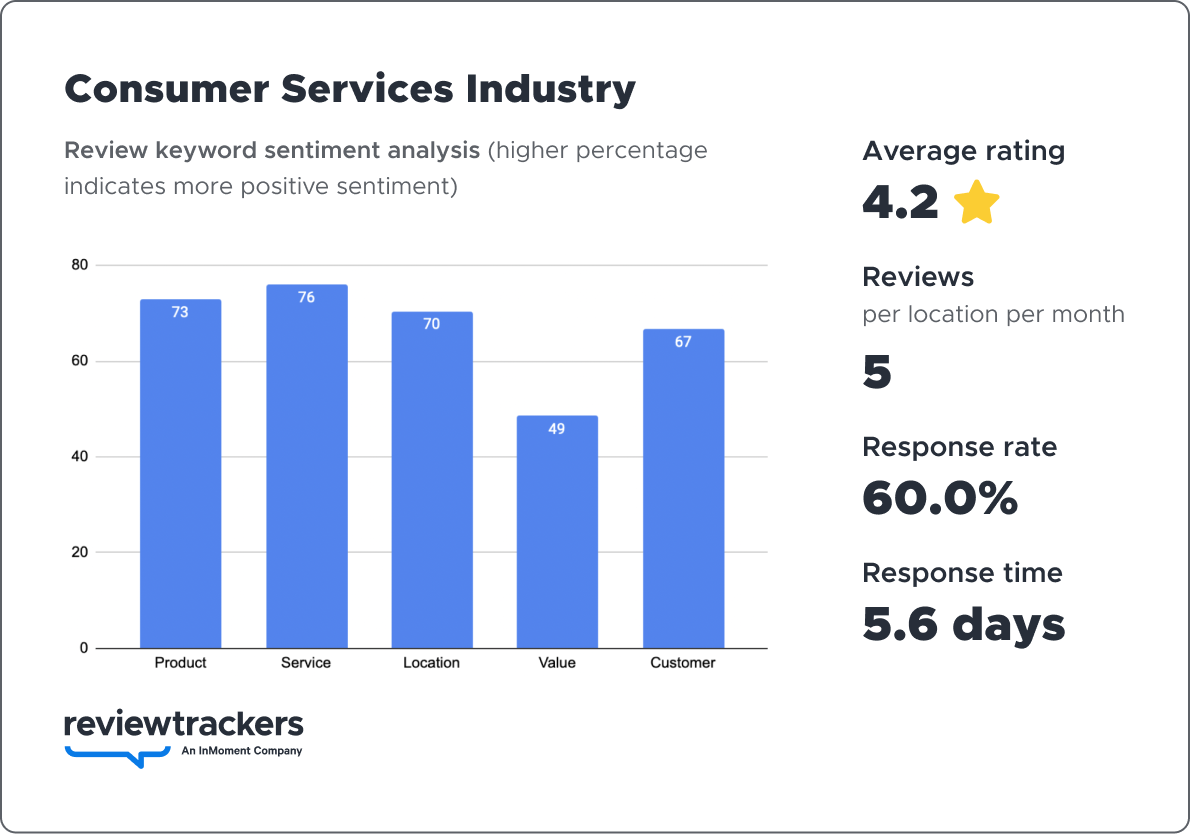
Consumer Services
With only an average of five reviews per month, consumer services brands have a benchmark rating of 4.15, which is only slightly lower than last year’s 4.19 score. However, companies only bring in 5 reviews on average every month. Furthermore, it takes nearly 6 days to get back to a customer when a review is published.
Takeaways
The low number of reviews is a glaring issue, and teams need to have a plan for asking for reviews to differentiate from competitors and garner more social proof for the financially discerning consumer. Based on the competitive intelligence data gained with review sentiment analysis, brands need to create enticing revenue-generating sales plans for customers, as evidenced by the low positive sentiment towards value-based keywords.
In the current economic climate, these pricing and selling changes can be an easy way to generate both revenue and retention. Combine those strategies with a focus on overall atmosphere and experience from staff at each location, and your teams will have ample chances to turn new customers into loyal brand advocates.
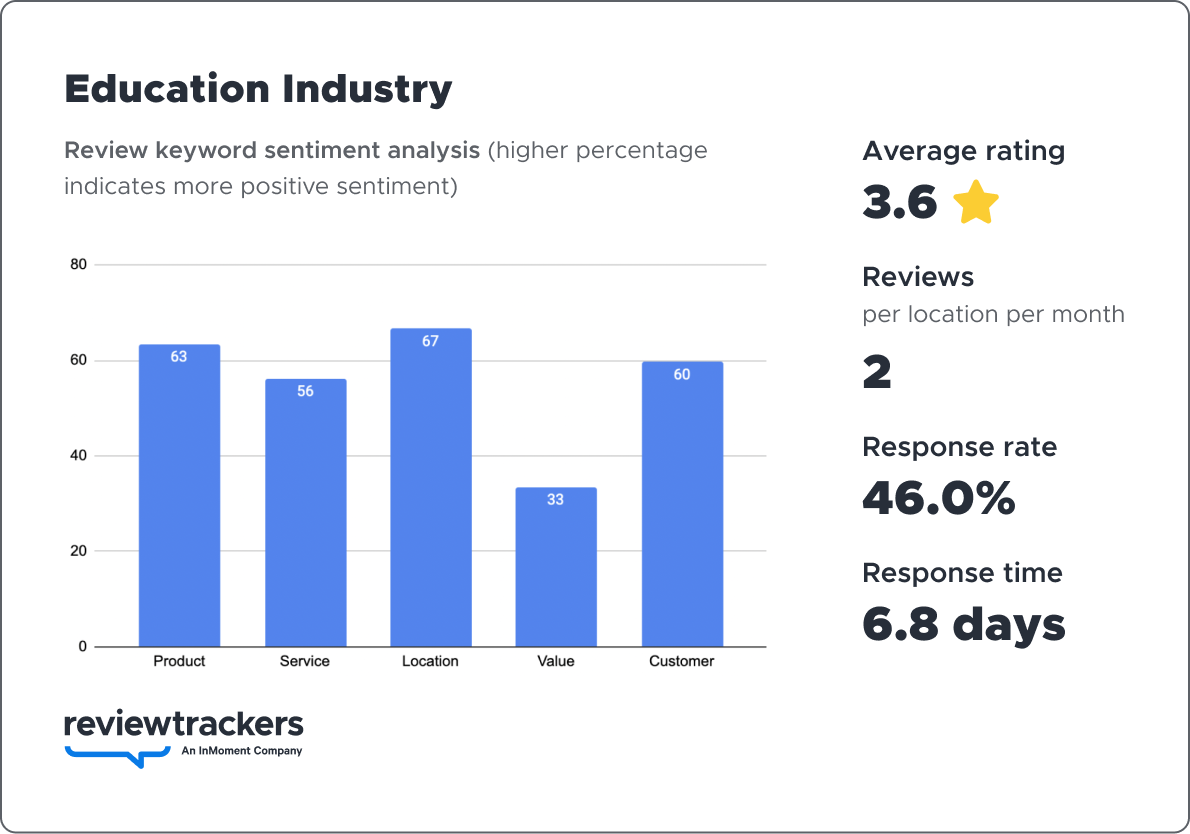
Education
The education industry sees a low benchmark average of 2 reviews every month, with a rating of 3.63. What’s worse is that the response rate sits at a low benchmark of only 46%, meaning that teams are responding to just under half of the already low number of reviews they receive – and it takes about a week for the industry to respond!
Takeaways
To further improve on metrics and easily become industry leaders, brands in the education industry need their teams to be more aggressive when asking for reviews, and be quicker when responding to feedback. Faster responses tell customers that your business is actively listening to feedback and striving to make changes that greatly benefit the way people learn.
It’s also vital to include customer experience, operations and other important teams in the sharing of customer experience analytics to find trends in feedback that can steer future decisions in the right direction, satisfying current customers and easily attracting new ones.
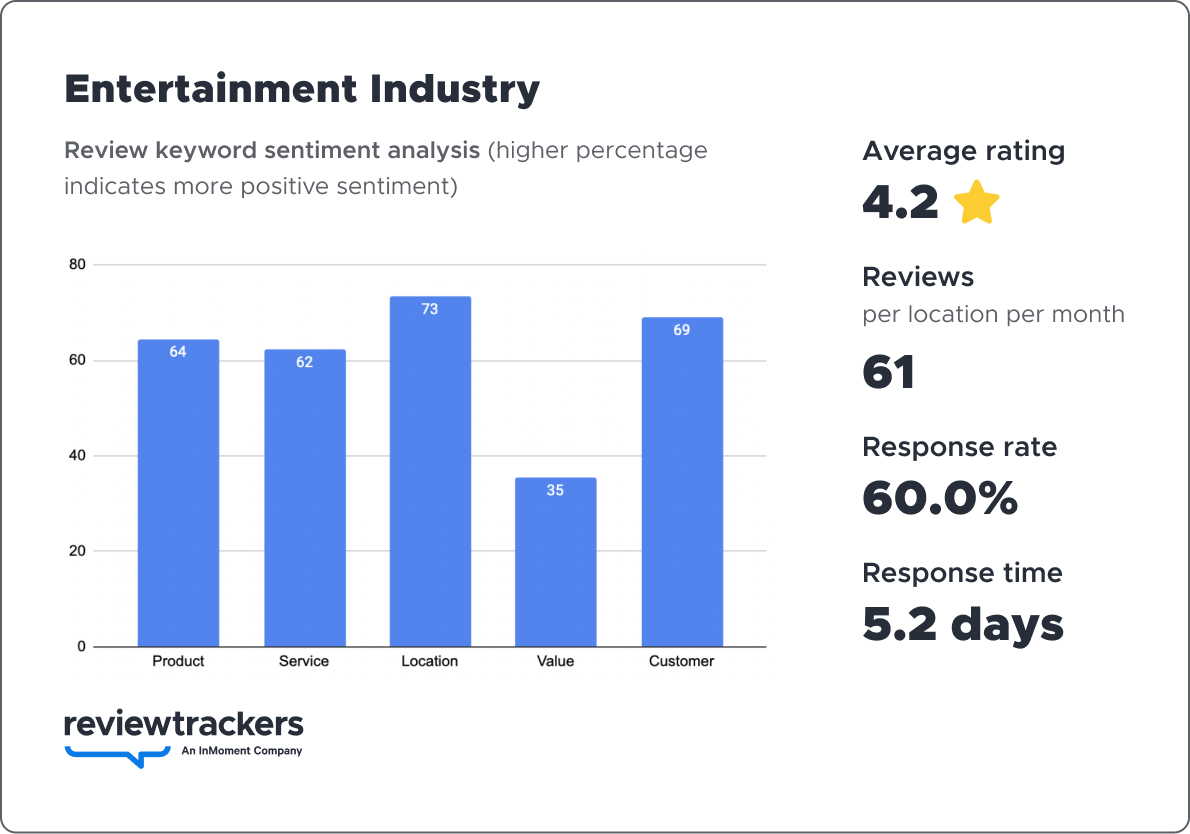
Entertainment
The entertainment industry slightly increased its review count lead benchmark (the entertainment industry’s review volume is the highest ofany industry), and more importantly, responded to more reviews as shown by its 60% benchmark response rate, a 6% increase compared to last year’s data. However, even with more reviews and responses, the industry still takes about 5 days to get back to customers.
Takeaways
To pull ahead of the competition and improve online visibility, entertainment brands need to be faster at responding to reviews. To save on overhead and bandwidth, part of this process can be automated, however customer experience teams also need to pay attention to what each customer is saying in their feedback with customer experience analytics software. Analyzing and implementing this type of business intelligence data can improve your company’s operations overall, creating loyal returning customers and easily compelling patrons to leave more feedback.
Financial Services
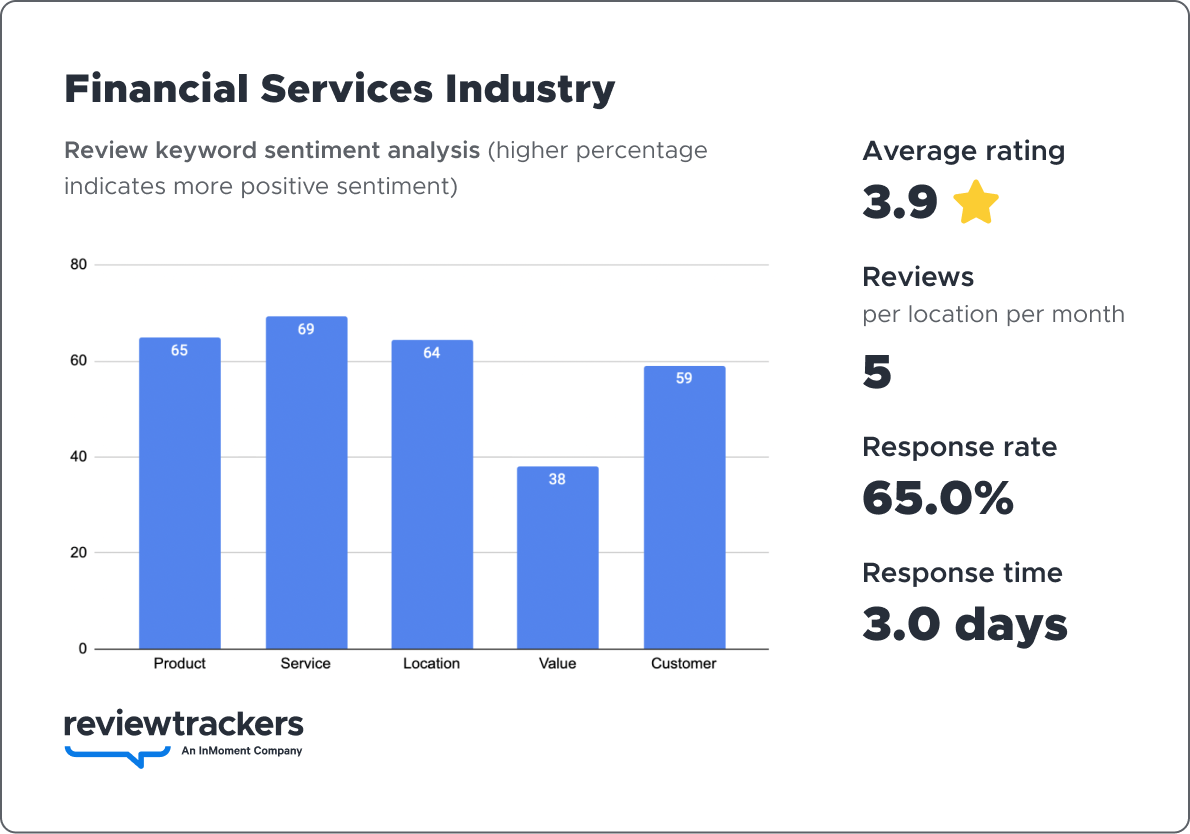
The financial services industry slipped to a 3.95 benchmark average, and slipped even further down in terms of response rate, (a benchmark of 65%) – a significant decrease from 73% the year before. Response time is still 3 days, but the dip in both rating and response rate is a glaring issue that, if improved, could easily solidify a brand as an industry leader.
Takeaways
With only an average of 5 reviews gathered per month, financial institutions can easily outperform competitors with a robust review request strategy that leads to better reputation gains, online visibility and impact to the bottom line. Once those reviews come in, it’s important to also have a response plan in place for your team to create positive differentiators in consumer engagement that lead to better retention.
By contrast, reducing the amount of review responses to feedback only makes it harder to gain consumer trust in a time when brand perception in financial institutions is vital to long-term success.
Healthcare
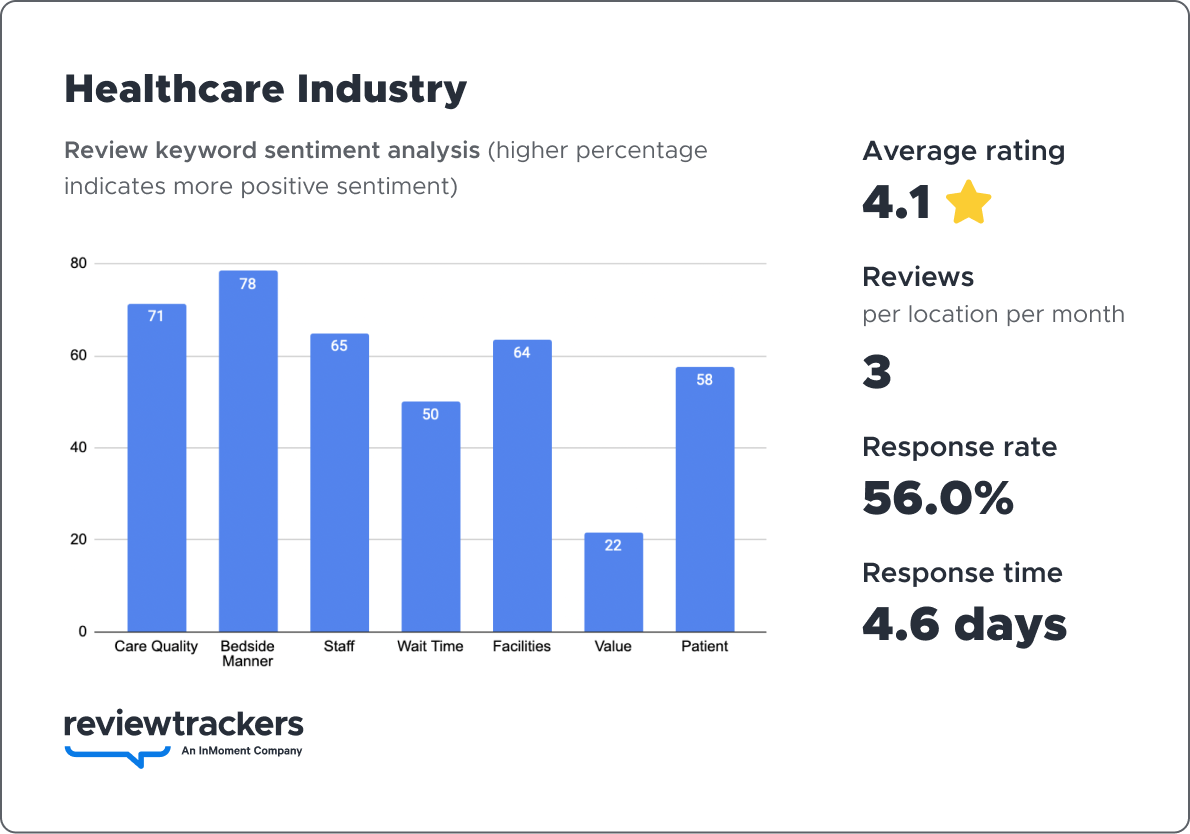
Our annual checkup of the healthcare industry shows both positive and negative outcomes. On average, the industry still brings in a low 3 reviews per month and the sentiment towards value has dropped by 7%, showing that people might think twice about coming for an appointment or procedure if the cost is too high. However, healthcare brands are becoming more aware of their patient reviews. The response rate benchmark is up to 56% from 52% and response time is now around 4 days instead of 5, signaling a better focus in reputation management.
Takeaways
Asking for reviews should be a top priority if healthcare brands want to see a boost in loyal patients, and a chance to compete with industry leaders. Another way to increase patient loyalty is to share customer experience analytics data companywide and use the insights to guide operational changes and patient experience improvement.
Making sense of large amounts of unstructured data (such as reviews) allows your teams to easily see where patients are experiencing friction points or issues. This can help create strategies for your operations team that meet and exceed patient expectations while still delivering a high level of care.
Hospitality
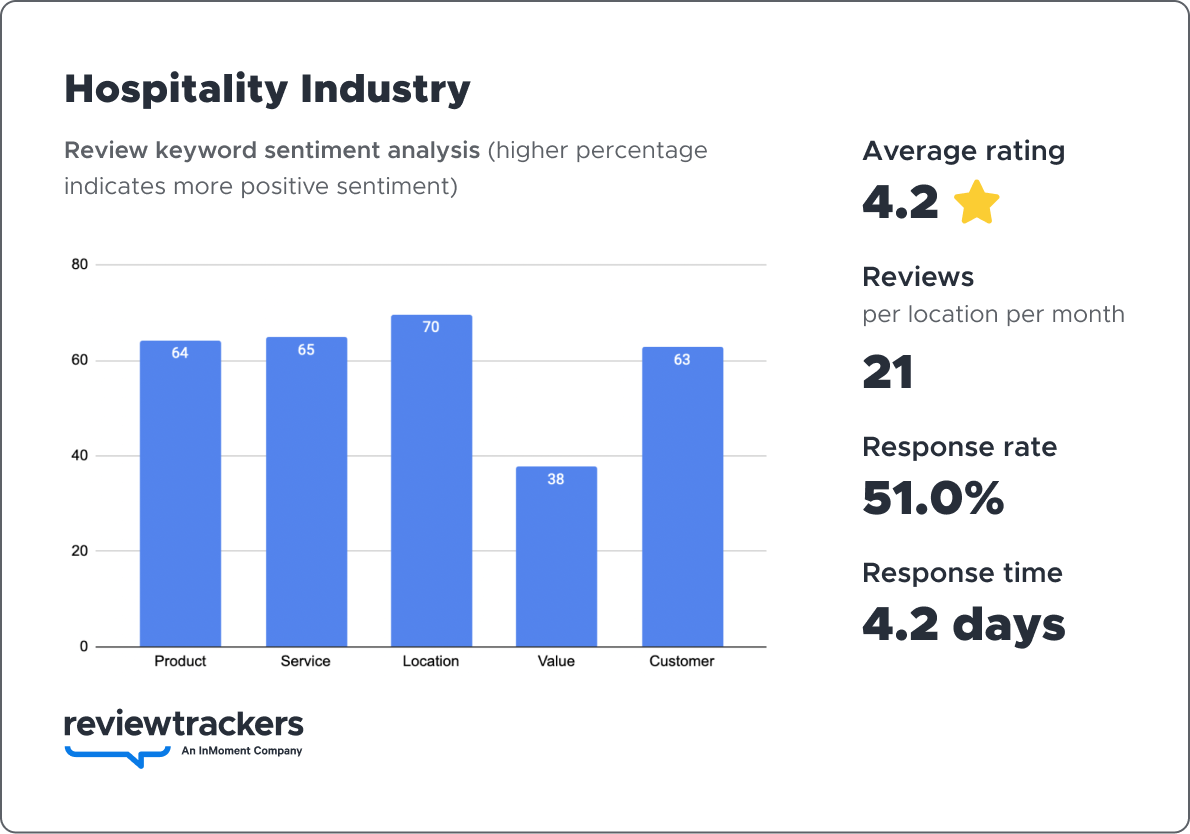
Compared to last year’s benchmarks, the hospitality industry is showing some major improvements. Response rate jumped from 40% last year to 51%, and response time greatly improved – decreasing to 4 days from a full week. Review volume for this industry is typically high, with an average of 21 reviews per month, but the overall rating benchmark dropped slightly to 4.15 stars.
Takeaways
Take note of the improved response rate and timing metrics, and be sure your teams have a plan in place to keep it up – especially as consumers look for a balance between value and luxury for their hospitality needs. Crafting a review response strategy that constantly integrates customer feedback can help your team further differentiate your brand from the competition with responses that show more attention to detail and dedication to prioritizing the customer experience.
Tapping into business intelligence data through existing reviews and applying those insights to business operations make it easy to create loyal customers – an even more cost-effective strategy than relying on acquiring new ones!
Insurance
Review volume is typically low in the insurance industry with an average of 2 reviews per location per month – but the industry generally sees a high rating benchmark of 4.54 out of 5 stars. Response time improved significantly – decreasing to 7 days from an average of 15 the previous year. Consumers care a lot about value: positive sentiment related to value-based keywords increased by 7% year-over-year.

Takeaways
As a whole, the industry is becoming more aware of the value of customer reviews, as evidenced with the faster response time. But a fast response should be the standard for your company. To go above and beyond, your teams need to create an effective plan that streamlines the process of asking for reviews, which will improve volume (a factor in online visibility) as well as the sample size of customer feedback.
A strong, central plan of this magnitude allows your various teams and leadership to identify areas of customer experience improvement within your organization. More reviews can also help with social proof, which can be a valuable marketing tool your team can leverage to easily reach and resonate with new customers looking for better, long-term insurance options.
Legal
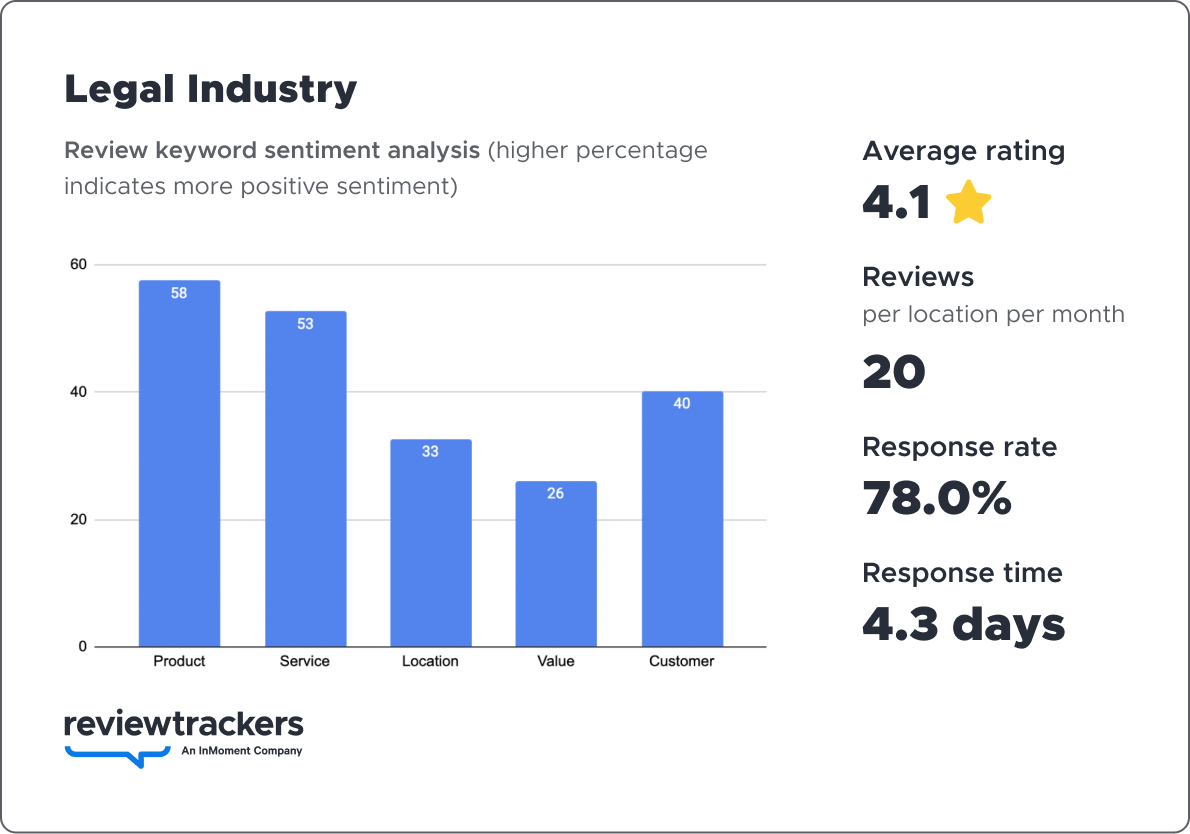
The legal industry improved its reputation benchmarks: average review volume increased from 7 to 21 per month, and response time decreased down to 4 days, another positive measure. However, those reviews also revealed that customers have an issue with the current state of services. Product-based keywords in reviews had a 9% decrease in positive sentiment and service-based keywords saw a 10% decrease.
Takeaways
Legal brands took important steps by improving review acquisition and response, but paying attention to and leverage data analysis and business intelligence will make any legal company an industry leader. Employing powerful customer experience analytics can reveal trends in consumer sentiment, which can be leveraged for business operations, customer experience strategies, and further improvements that reduce retention rates and unhappy clients. Ensuring your team has a reliable review gathering and response strategy will also bolster brand efforts to stand out among rivals.
Real Estate
The beginning of the year through late fall was a tumultuous time for the real estate market, and people did not like their experience, as evidenced by the drop in rating benchmark from 3.83 to 3.78 year-over-year. Response rate also dropped 14% to 54%, but response time did see an improvement; a decrease of 2 days.
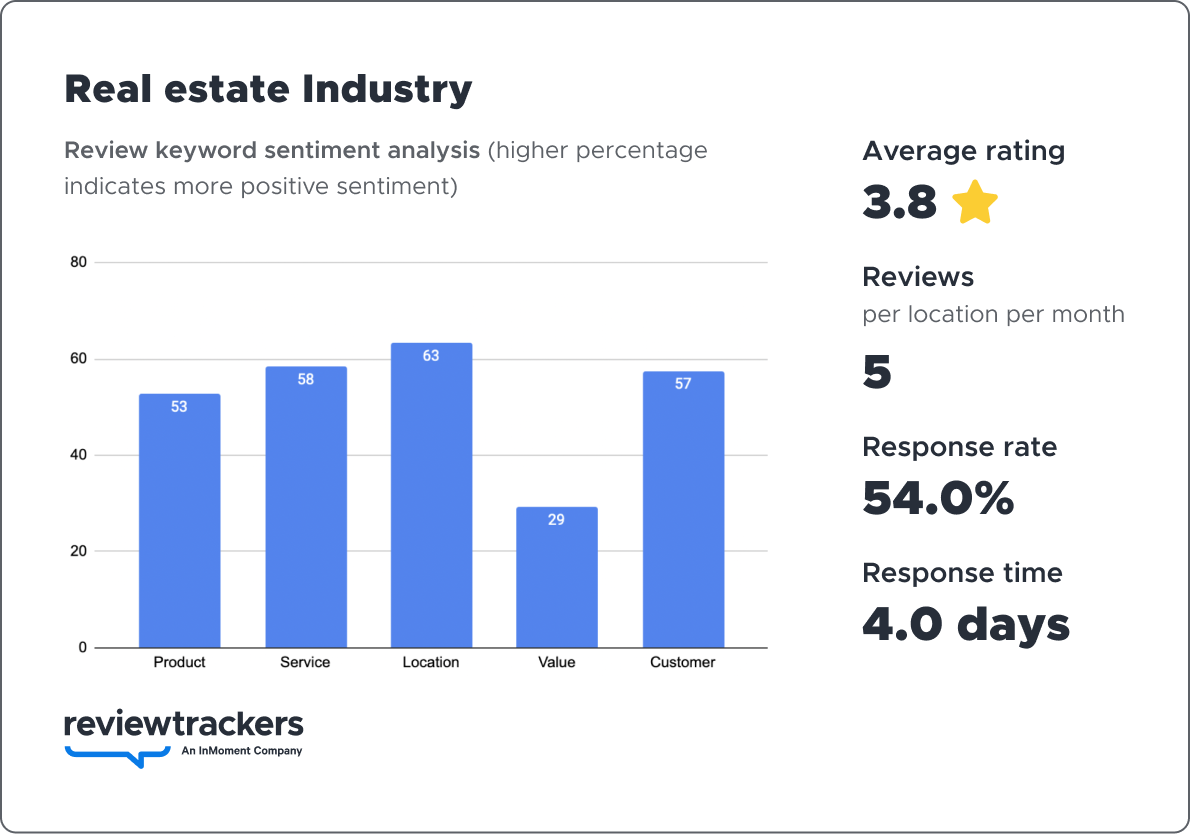
Takeaways
Real estate brands as a whole need to better prioritize review response times – and it’s also important to increase the data pool and guide your teams in soliciting more feedback. Doing so allows for a better customer experience that leads to a constant stream of clients and referrals that are willing to conduct business with your team.
Having clients rave about their experiences with your company can make the process easier for those jumping into the industry as customers for the first time. This also makes it easier for your team to create an experience that creates happy customers and a steady stream of referrals because of previous feedback.
Restaurant
The restaurant business saw an incredible shift in its response rate year-over-year. Last time around it was around 36% but the industry as whole now responds to 65% of feedback. However, that’s the only win for the industry from a reputation perspective. The overall average rating benchmark fell slightly to 3.84 (from 3.95 last year), review volume decreased to 16, and the response time nearly doubled to 10 days.
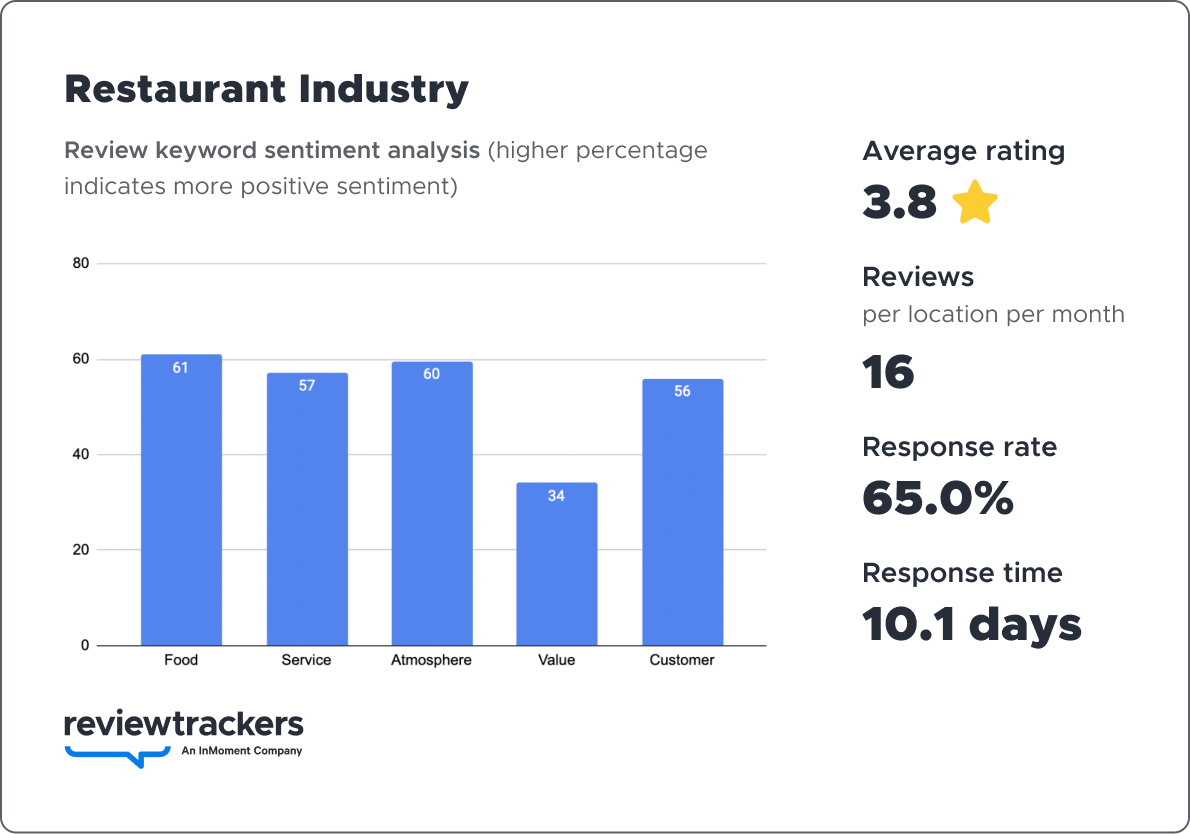
Takeaways
The boost in review response is a great start, but other metrics can’t be forgotten either. Restaurateurs need to direct their teams to create a comprehensive online review management strategy that both attracts and retains diners. With a complete plan, teams can easily map the customer journey and make improvements to the dining experience.
Applying sentiment analysis and other business intelligence data above to operations and company protocols also helps deliver on dining expectations, which can easily sway customers to come back for repeat visits.
Retail
In order to succeed in 2023, retail brands need to recover some lost ground. On average, review volume is at 11 reviews as opposed to 15 the previous year, and and response rate plummeted from 65% to 46%. There was also a 5% drop in positive keyword sentiment for value-based keywords.
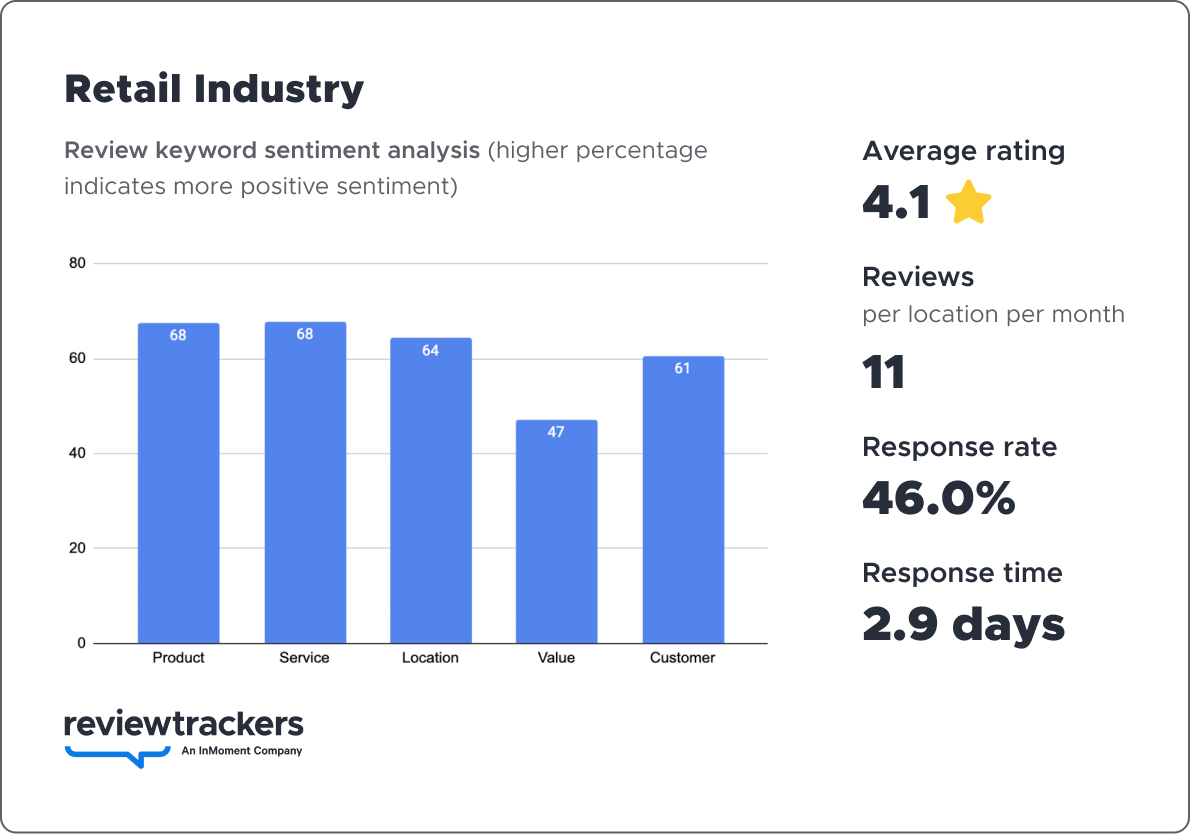
Takeaways
The good news is that retail brands can easily beat out the competition by prioritizing a few main reputation management strategies. Increasing review volume by asking for reviews and ensuring your team responds in a timely manner gives you a larger pool of business intelligence data you can apply to potential operational changes.
With customers complaining more about the value of products and services sold, it’s important to make note of their complaints and have your teams apply those insight-based changes to your offerings. Only by listening to customers and providing an experience that exceeds expectations can your company pull ahead in a fiercely competitive environment and retain customers for the future.
Software
While software companies had a slightly lower average rating this year, they improved their reputation management plans in other places. For instance, the average response rate jumped from 32% to 79%. Response time is now just 2 days, a far cry from the previous report’s data of 35 days.
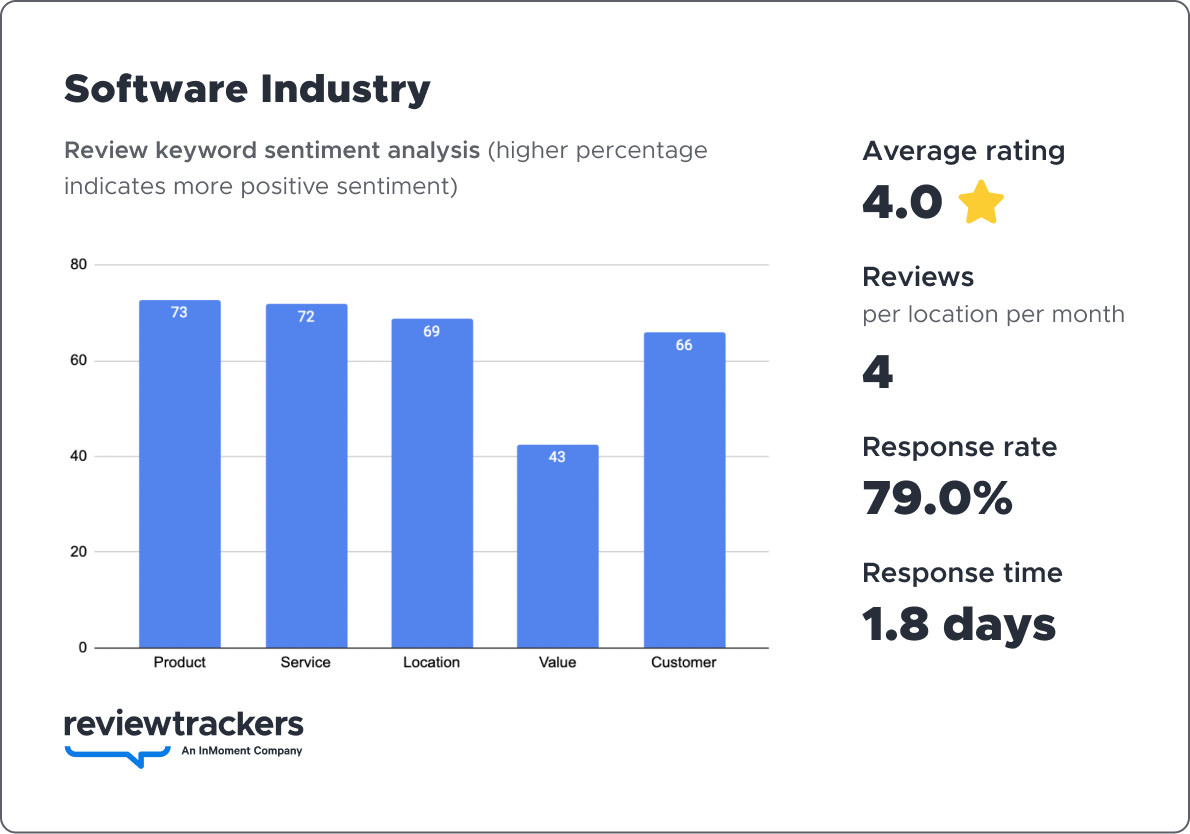
Takeaways
The missing link in the industry’s reputation plan is analysis and action. Taking the time to look closer at customer experience analytics with your team can reveal issues in the current version that can help fuel your upcoming product roadmap. Guiding your team to gain these insights before they become a serious issue for users shows a dedication to UX and overall product improvement that keeps customers happy.
Online Reputation Analysis Part 2: The Industry Leaders
The above section paints a data-driven picture of standard industry-specific benchmarks your teams should be hitting in relation to your competition, in addition to useful takeaways that you can immediately use to further distance your company from competitors.
As an advanced step, we also provide the data analysis of the top 10% of brands by industry below, which will arm you with insights and strategies you can implement with your teams and leadership to compare your own organization’s reputation performance with the best-in-class.
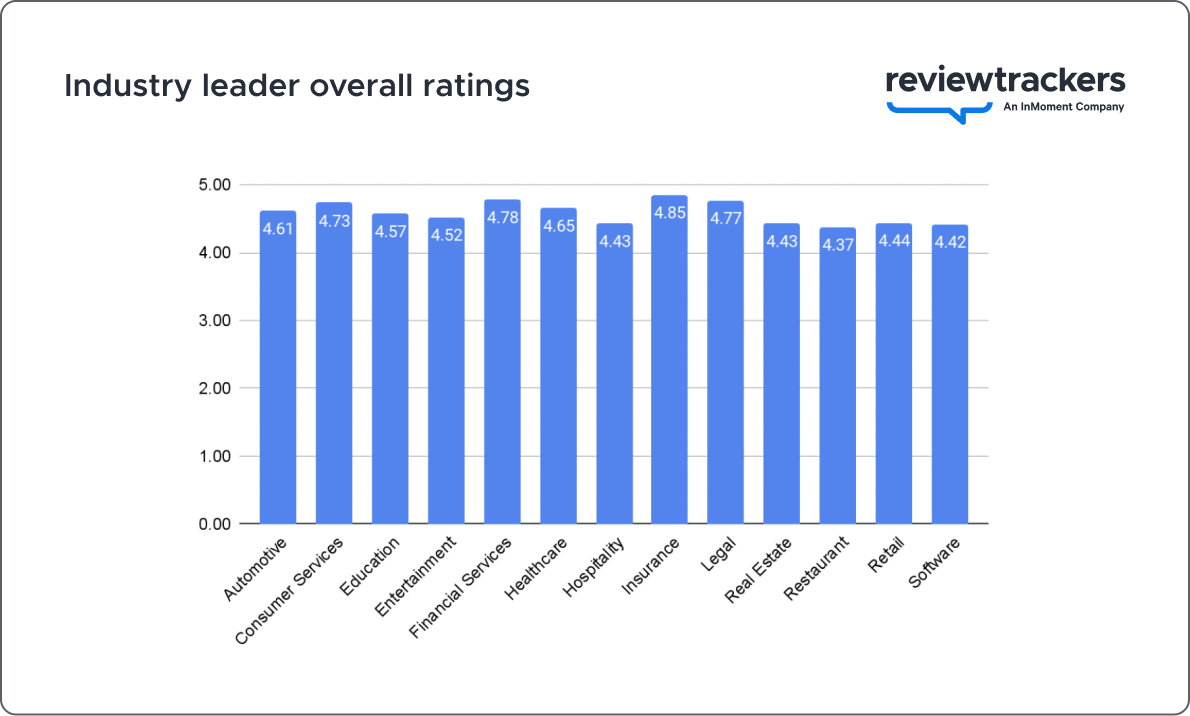
Ratings and Reviews
Leading the pack are the insurance and finance industries with a 4.85 and 4.73 rating, respectively, but it’s worth noting that both groups have some the lowest review volume by industry On the low side, the restaurant and software industries with a 4.37 and 4.42 rating, respectively. Other than providing a realistic reputation goal for each brand, this shows that while every company aims for the coveted 5-star rating, somewhere between a 4 and a 4.5-star rating is actually the more realistic, achievable, and trustworthy goal in every industry.
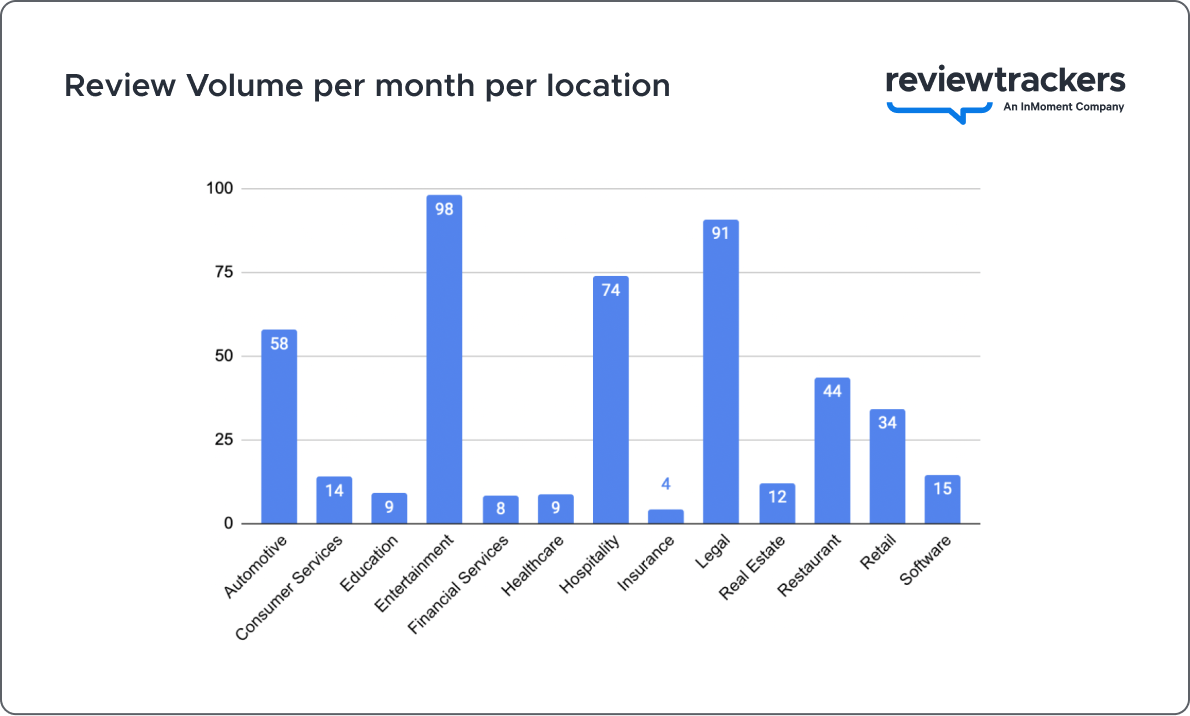
For review count, it seems that most industries can get double digit reviews, with the entertainment industry leaders gathering an average of 98 reviews a month. This is a worthwhile goal for most brands considering the customer reviews data shows that consumers expect at least 112 reviews to verify an overall rating. This is because reviews are the valuable social proof signals consumers rely on to make a purchase decision. A handful of recent reviews praising the brand or talking about the great shopping experience can easily bring in more customers. Of course, this requires your organization to have an effective review request strategy to gather as much consumer feedback as possible.
Response Time and Rate
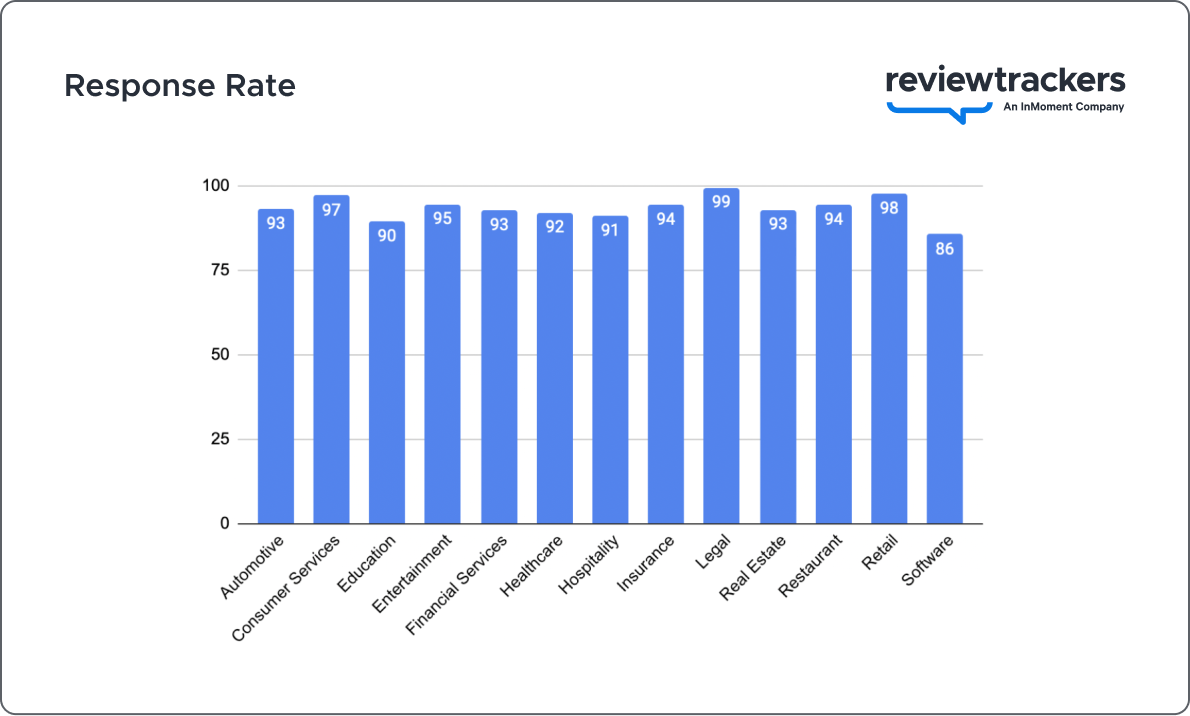
The secret to being an industry-leading organization is not overall rating and review count: it’s actually your company’s response rate. Case in point, most industries responded frequently, specifically between 86% – 99%. Out of all industries surveyed in this study, the leader – the legal industry – has a response rate of 99%. A large volume of 91 reviews/month doesn’t hurt, either.
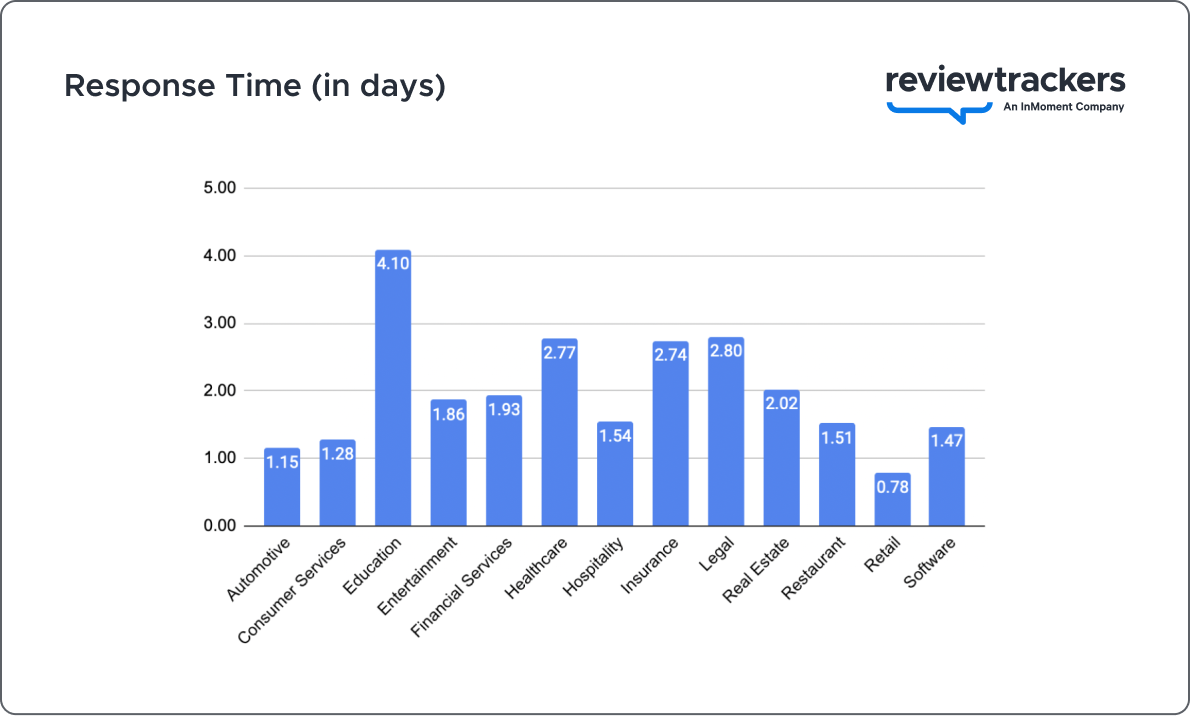
In addition to a high response rate, most industry-leading organizations responded to reviews in less than five days. A prime example of a quick response time can be found in retail, which has an average response time of less than one day. Top performing brands in that industry are not only constantly getting reviews; their teams are also responding to them quickly and professionally. By gaining leadership buy-in and guiding your teams on a similar strategy, your organization can send a message that the voice of the customer was heard loud and clear – whether in praise or criticism – which shows how much you value customers regardless of if they enjoyed the current experience.
The Customer Sentiment
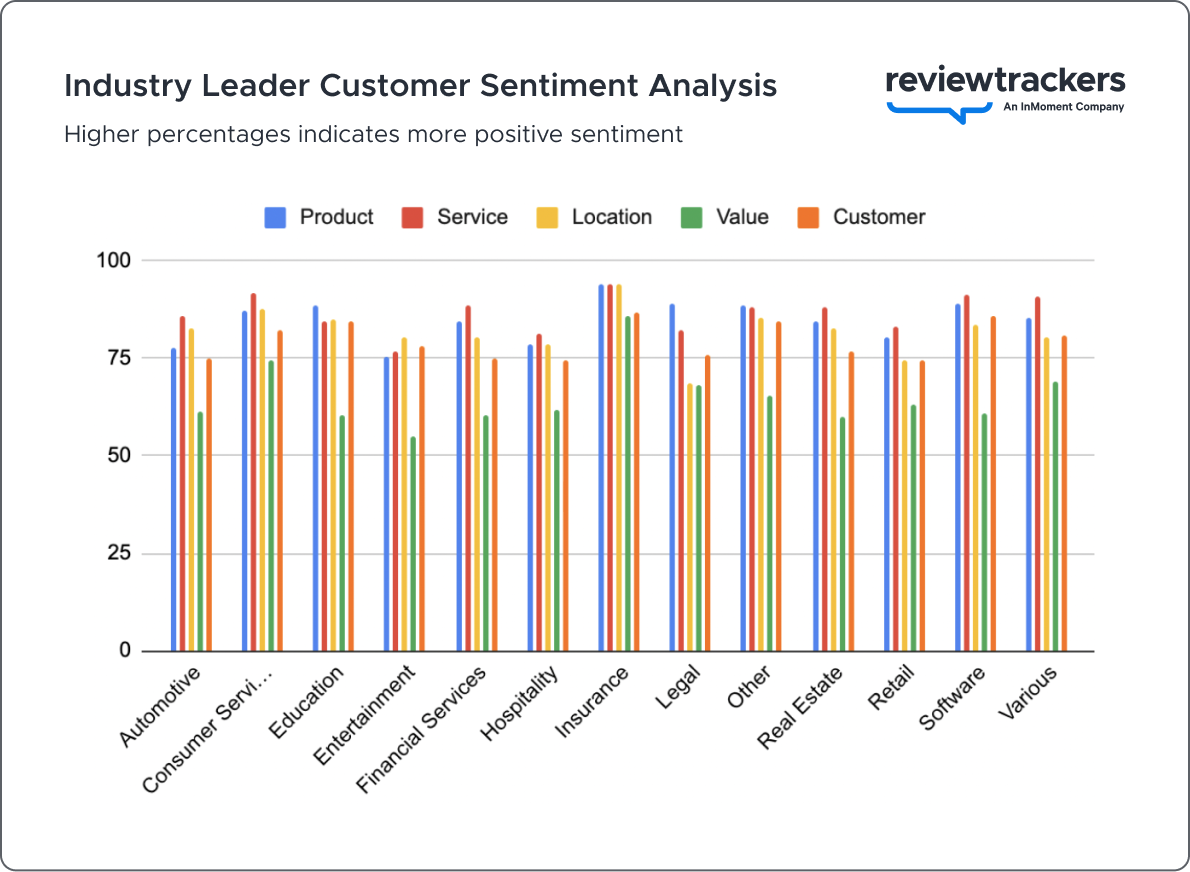
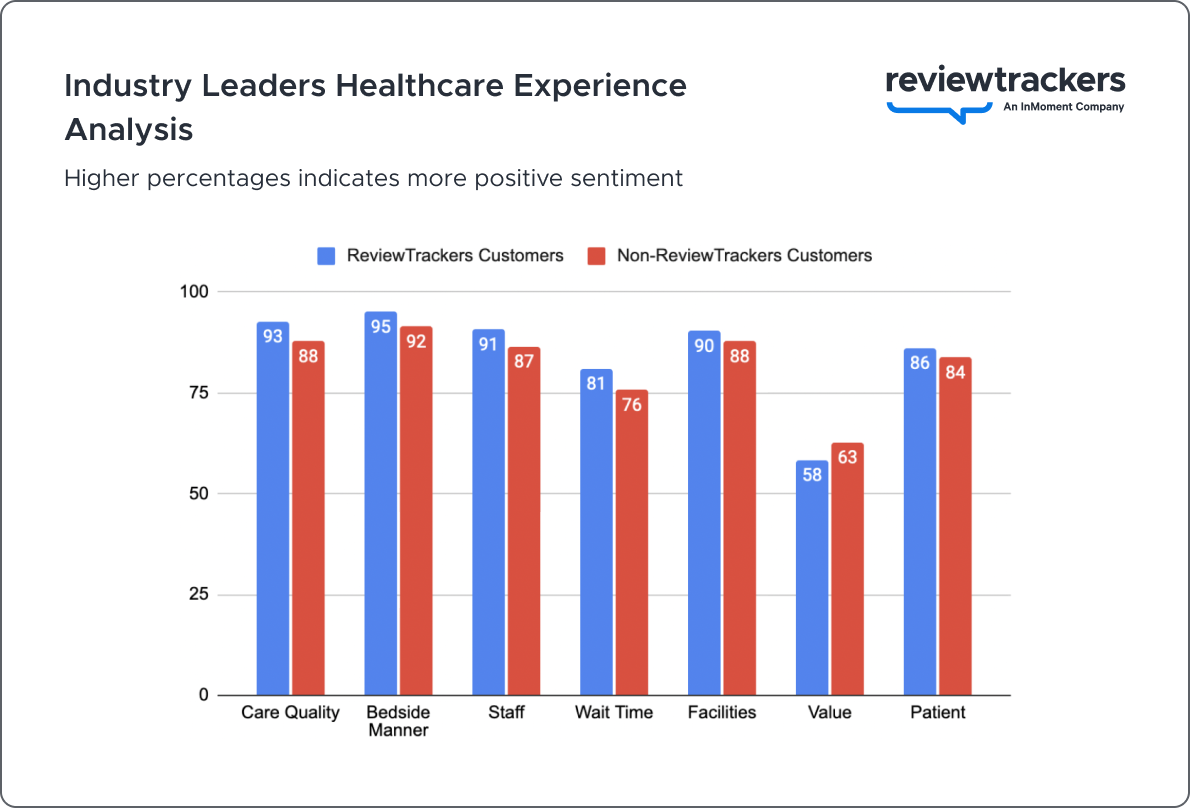
Typically among industry-leading organizations, product and service-based keywords saw positive sentiment with regard to feedback, based on the Experience Analysis graphs below.
Value-based keywords still have the lowest percentage of positive sentiment when compared to other keywords for each industry. Not only does this present major opportunities for brands to apply sales and operations programs to beat out their competition; it’s also a sign that even though value might be an issue, the experience in stores, with staff members, and the product itself can easily convince customers that what they are buying is worth every penny.
As far as industry-leading factors in healthcare and restaurants, there are a few differences and a few common factors. Though most factors related to the customer experience are positively perceived (service/bedside manner, facilities/atmosphere), value is still low – indicating that despite a seemingly overall positive experience, the total perceived outcome (value) can still be low and need improvement.
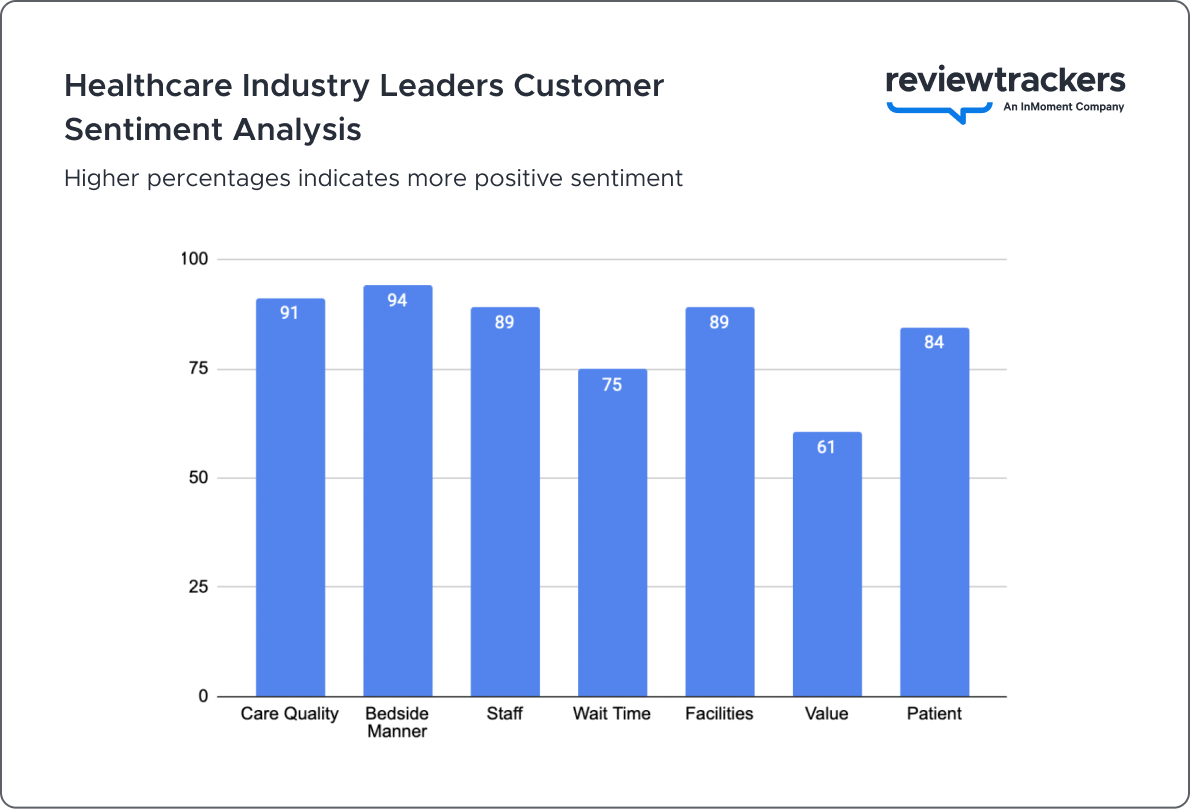
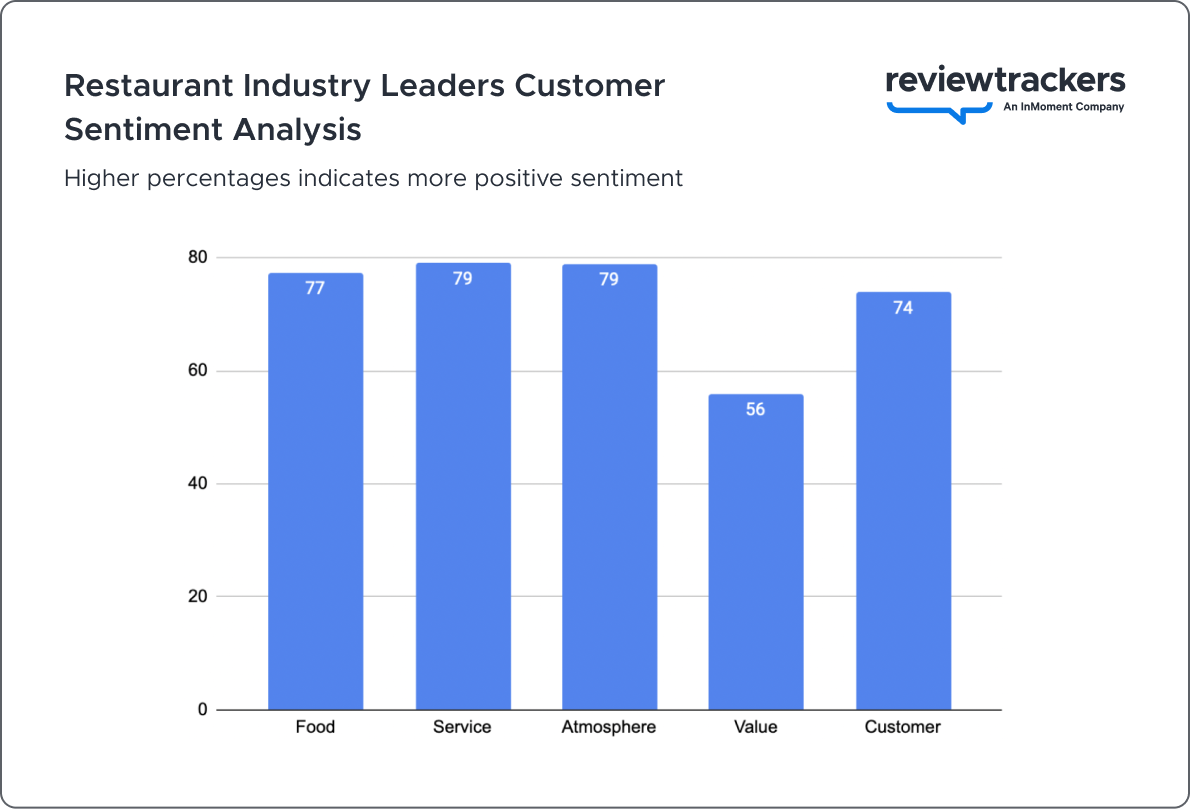
Without the Experience Analysis data above, it would be difficult for brands to figure out where to concentrate their efforts to improve operations – despite seemingly positive feedback overall, there are still some fundamental areas needing improvement that can make or break the customer experience, which can impact overall retention. With sentiment analysis, you know exactly where to put time and money that can lead to satisfied customers and a higher online reputation.
Online Reputation Analysis Part 3: The Differentiators
Now that you know what separates the industry leaders from the rest, it is time to dig deeper and find out how they did it. In some cases, the boost in performance came from using reputation management software like ReviewTrackers.
We recently mentioned the success of leaders in the legal industry in terms of response rate and review volume, but the latter is even more apparent when comparing ReviewTrackers customers to those who are not using the software. On average, ReviewTrackers users in the legal field gain 24 more reviews than those not using the software.
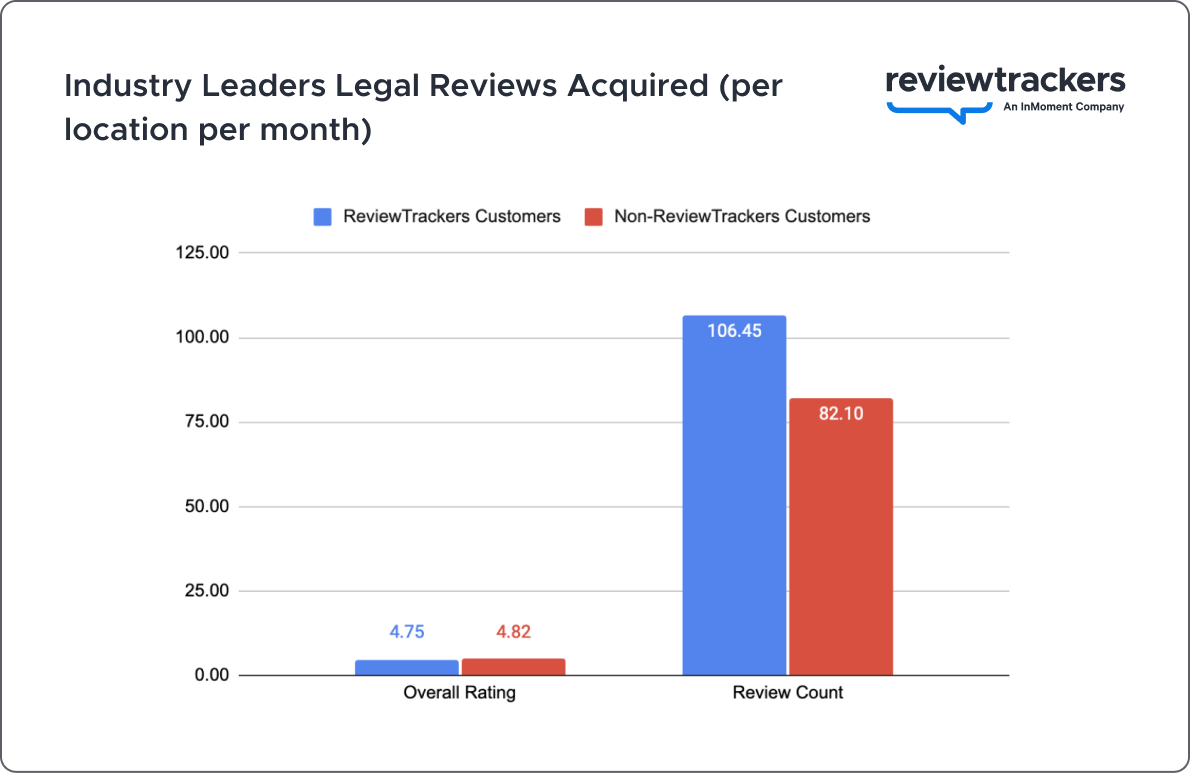
This is thanks to the platform’s powerful Ask Tool, which can easily create and send review requests on your organization’s behalf through multiple channels. This allows teams to leverage templates to automate the process of sending out requests so they can use that bandwidth for better personalization, strategy and other tactics.
Customer reviews data shows that only 28% of consumers will leave a review after a positive experience, but using these templates makes review outreach easier for both the brand and customer, creating more chances for positive feedback. With a well-planned review request strategy, brands can leverage email, SMS messages, or QR codes to effectively reach out to the customer and ask for their thoughts on the experience.
Another notable feature within ReviewTrackers is natural language processing (NLP), which helps organizations make sense of unstructured data for data analysis and business operation improvement. NLP powers ReviewTrackers’ Customer Experience Analysis features which organize and categorize feedback and review trends with sentiment analysis to help brands prioritize their areas of focus.
Earlier we looked at the review keyword sentiment analysis of the healthcare industry. When we looked deeper into the data, we saw that ReviewTrackers customers that are healthcare industry leaders had higher positive sentiment across most of the keyword sentiment groups. The same observation is also apparent among ReviewTrackers customers in the financial services industry, especially when you compare the positive value-based keyword sentiment of ReviewTrackers users at 77% to those not using the platform at 59%.
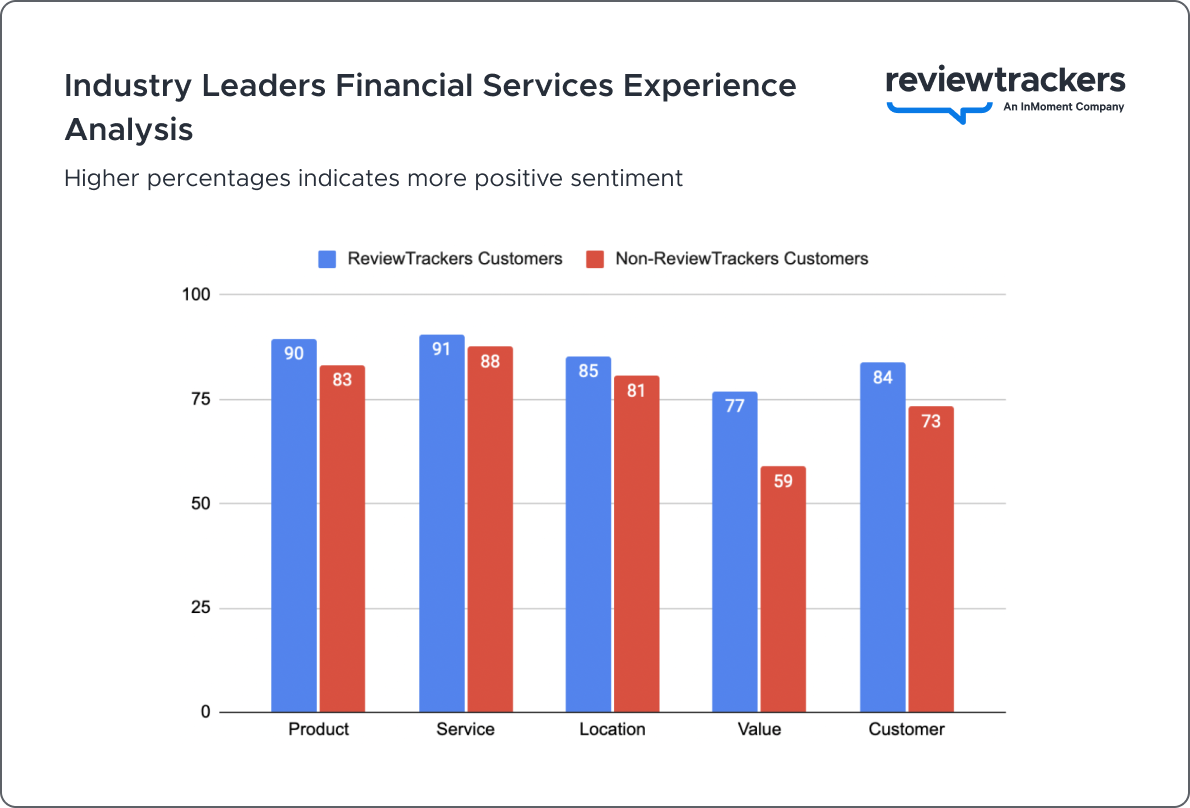
These data points show that brands using ReviewTrackers software are taking great advantage of Customer Experience Analysis to hone in on specific issues within the customer experience. The insights gained from the feature now fuel business operation and customer experience management strategies that keep customers loyal and reduce dissatisfaction.
Seeing reviews in this light helps brands find the right data to support unique and effective approaches to customer acquisition and retention. In the long run, these insight-driven plans streamline operations, change the customer experience for the better, and turn your loyal customers into powerful advocates for the brand.
Conclusion
As you start the new year, it’s important to keep these industry benchmarks in mind as part of your organization’s annual goals. With leadership buy-in, adopting best practices and insights from the industry-leader data above and guiding your team with the right tools and data, your brand has an opportunity to beat your competition, win your market and drive more revenue. Listening, engaging, and acting on customer feedback will make your organization customer-obsessed and create experiences that easily attract patrons and keep them returning to your business as loyal advocates for the long run.