Executive Summary
- Food and Drink.
- Fan Experience.
- Family Experience.
- Facility.
2. The top 5 stadiums were:
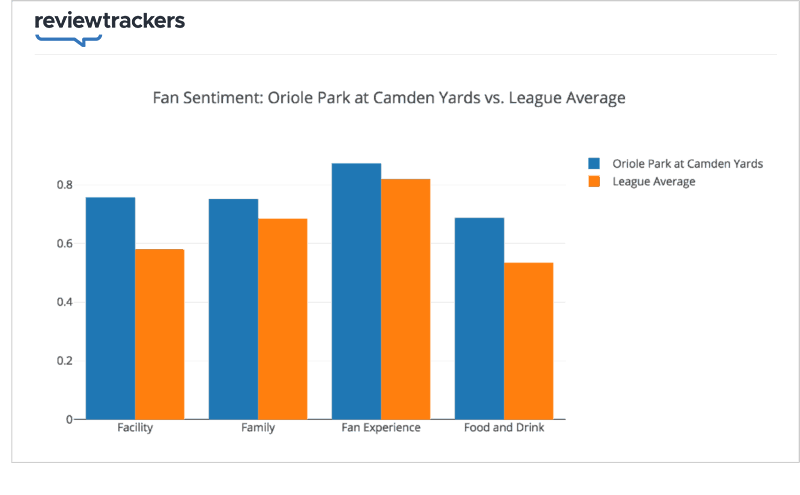
- Oriole Park at Camden Yards: 1st overall and top-rated facility.
- PNC Park: 2nd overall, top-rated stadium for families, and top-rated fan experience.
- AT&T Park: 3rd overall, 2nd for food, and top-rated hot dog.
- Safeco Field: 4th overall.
- Ewing M. Kauffman Stadium: 5th overall and 2nd for family experience.
3. Overall fan sentiment at baseball stadiums has increased 17 percent over the last seven years, suggesting that teams are providing a better in-game experience for fans.
4. The hot dog is still the most talked about food item at a baseball game (6 times more popular than anything else).
5. Fan sentiment rates barbecue as the best ballpark food, ranking it 4 times better than hot dogs.
6. Iconic stadiums, Wrigley Field and Fenway Park, rate highly in terms of overall star rating, but get mediocre fan sentiment scores due to middle-of-the-road food, facility, and in-game experience.
Getting Data by Listening to Fans
Each year, baseball fans leave tens of thousands of reviews of their stadiums on Google, Facebook, and other review sites.
If you can find a way to take all that text and convert it into data, you’ll have thousands and thousands of data points — and a new source of insights into how fans talk about and experience going to a baseball game.
Here’s how we did it.
We used ReviewTrackers’ natural language understanding algorithm to analyze the sentiment in more than 130,000 reviews for stadiums. Out of the 130,000 reviews we looked at, the algorithm identified 100,000 moments when fans said something negative about their stadium and 450,000 moments when fans said something positive.
Each of these moments is tied to a keyword (“hot dogs”, “seats,” etc.), which allows us to score each stadium for topics that fans talk about.
We took the most common keywords, grouped them into four main topics — food and drink, facility, family friendliness, and fan experience — and averaged the sentiment scores for these topics. This allows us to score each stadium for each topic, as well as provide an overall ranking for stadiums, which looks like this:
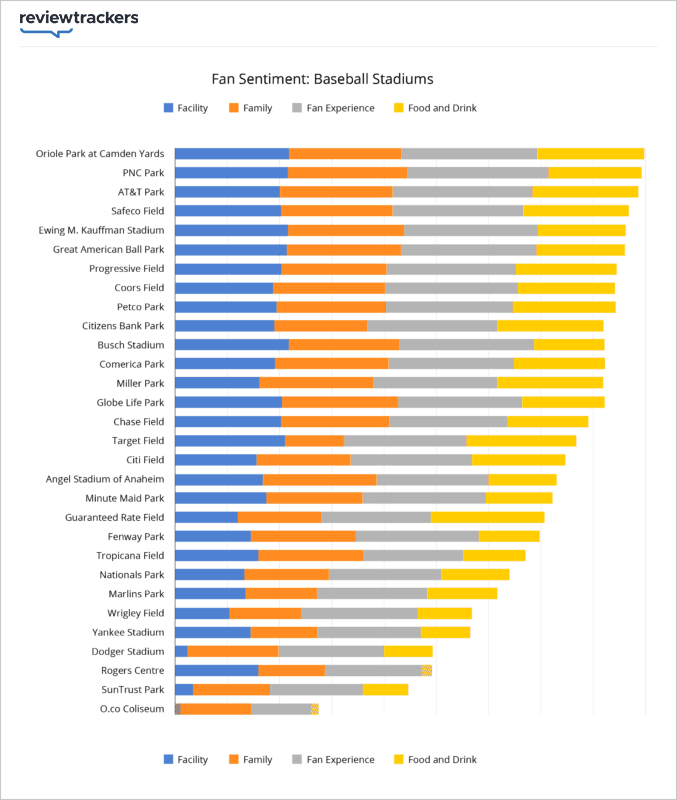
If you’re interested in the actual numbers, you’ll find them below. For each topic, sentiment scores range from -1 to +1, so you’ll see that, for the most part, stadiums deliver very positive experiences to fans.
| Stadium | Facility | Family | Fan Experience | Food and Drink | Overall |
| Oriole Park at Camden Yards | 0.757802747 | 0.752107926 | 0.873283396 | 0.687303253 | 3.070497321 |
| PNC Park | 0.743190661 | 0.786538462 | 0.926634146 | 0.607894737 | 3.064258006 |
| AT&T Park | 0.693961952 | 0.742471443 | 0.918824701 | 0.696969697 | 3.052227794 |
| Safeco Field | 0.702099738 | 0.736654804 | 0.853111712 | 0.694369973 | 2.986236227 |
| Ewing M. Kauffman Stadium | 0.730978261 | 0.771019678 | 0.873270211 | 0.549473684 | 2.924741834 |
| Great American Ball Park | 0.717444717 | 0.730711044 | 0.88752784 | 0.588235294 | 2.923918895 |
| Progressive Field | 0.713091922 | 0.699588477 | 0.842741935 | 0.666666667 | 2.922089002 |
| Coors Field | 0.636495293 | 0.766743649 | 0.880914826 | 0.626043406 | 2.910197174 |
| Petco Park | 0.630173565 | 0.720792079 | 0.819393042 | 0.678632479 | 2.848991165 |
| Citizens Bank Park | 0.674731183 | 0.609561753 | 0.854956753 | 0.699582754 | 2.838832443 |
| Busch Stadium | 0.744058501 | 0.720754717 | 0.893911095 | 0.471615721 | 2.830340033 |
| Comerica Park | 0.653084983 | 0.751277683 | 0.820210787 | 0.604790419 | 2.829363872 |
| Miller Park | 0.559290383 | 0.750819672 | 0.814587594 | 0.698025552 | 2.8227232 |
| Globe Life Park | 0.7100271 | 0.767772512 | 0.816216216 | 0.527186761 | 2.82120259 |
| Chase Field | 0.69104355 | 0.705714286 | 0.778833107 | 0.538860104 | 2.714451046 |
| Target Field | 0.728506787 | 0.388888889 | 0.812865497 | 0.728222997 | 2.65848417 |
| Citi Field | 0.569429494 | 0.624020888 | 0.795669824 | 0.618953603 | 2.608073809 |
| Angel Stadium of Anaheim | 0.582222222 | 0.761290323 | 0.753765553 | 0.448094612 | 2.545372711 |
| Turner Field | 0.487944891 | 0.703204047 | 0.841359773 | 0.467625899 | 2.500134611 |
| Minute Maid Park | 0.599702381 | 0.626373626 | 0.810562572 | 0.443742099 | 2.480380678 |
| Guaranteed Rate Field | 0.413427562 | 0.549019608 | 0.719063545 | 0.749622926 | 2.431133641 |
| Fenway Park | 0.507911392 | 0.699332991 | 0.805107203 | 0.396061269 | 2.408412856 |
| Tropicana Field | 0.570652174 | 0.69261477 | 0.65990991 | 0.411371237 | 2.334548092 |
| Nationals Park | 0.469043152 | 0.556521739 | 0.746806039 | 0.457817773 | 2.230188703 |
| Marlins Park | 0.470108696 | 0.479224377 | 0.727835052 | 0.474613687 | 2.15178181 |
| Wrigley Field | 0.367684478 | 0.597532768 | 0.781116751 | 0.370629371 | 2.116963368 |
| Yankee Stadium | 0.505773672 | 0.442307692 | 0.681514477 | 0.3375 | 1.967095841 |
| Dodger Stadium | 0.072146119 | 0.603896104 | 0.69088812 | 0.323890463 | 1.690820805 |
| Rogers Centre | 0.568042142 | 0.426791277 | 0.70619469 | -0.08 | 1.62102811 |
| SunTrust Park | 0.11627907 | 0.515570934 | 0.612903226 | 0.290780142 | 1.535533372 |
| O.co Coliseum | -0.031818182 | 0.507936508 | 0.434920635 | -0.051136364 | 0.859902597 |
So why is this data interesting?
If you survey fans about stadiums, fans respond to the structured questions you provide. You design the survey and, potentially, your questions can impose biases — and might imply that all stadiums are judged by the same standards. A survey does not allow for the fan to speak as freely as they might in an online review, where there is no structure and where feedback is more immediate.
If you listen online, instead, to what fans are saying about each stadium experience, you let them tell you what’s important. You let them guide the conversation. And one of the things you discover is that fans judge some stadiums differently than others — and because we’re able to look across all stadiums, we can spot outliers, and identify which stadiums are doing something exceptional.
In this analysis, we’ll look more closely at each of the four topics, and highlight notable trends and outliers we come across.
Overall Star Ratings at MLB Stadiums
Before we get into the nitty-gritty data, let’s zoom out and talk a little more about why this analysis is helpful.
Fans, in general, leave very, very positive reviews about their ballpark. Everything is between 4.0 and 4.7 stars.
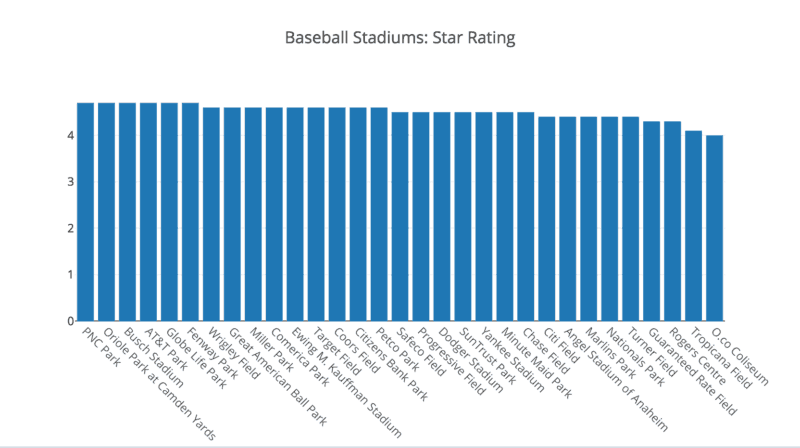
That’s actually a problem.
Fans are saying “everything is great” when they rate a stadium, but if you go back and read the text of their reviews, you’ll see a lot of complaints. Remember: We found 100,000 negative moments in reviews.
To get a more nuanced understanding of stadiums, we’ll need a more sensitive instrument to help us read and score those moments.
How to Read 130,000 Baseball Stadium Reviews
Algorithms are very complex programs that do very simple things.
A natural language algorithm can extract the main keywords of a review (“hot dogs,” “seats,” “jumbotron,” etc.) and tell us whether someone is using the keywords positively or negatively.
When a reviewer talks about the “awesome nachos” at Dodger Stadium, the algorithm flags the nachos keyword and tells us it’s 90 percent sure the reviewer liked the nachos.
When a reviewer of Oakland-Alameda County Coliseum says the bathrooms are so gross the team should “burn down the toilets and start from scratch,” the algorithm says it’s 93 percent sure the reviewer is describing a bad toilet experience. Not sure how bad things would have to be to get to 100 percent, but you get the idea.
There are thousands of really, really sophisticated ways to apply this data, but let’s start with an urgent baseball question: which stadium has the best hot dogs?
Measuring the Best Hot Dogs in Baseball
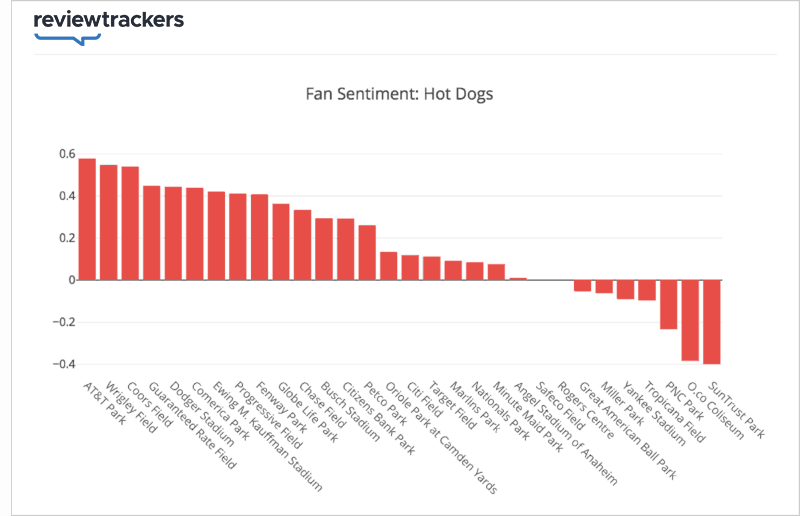
As one AT&T Park reviewer put it, “I would never review a ballpark. Unless it had a bacon wrapped hot dog with roasted jalapenos and chips covered in carnitas … Then, and only then, will I write a review.”
Translation: AT&T Park has fancy hot dogs.
But many reviews also mention the stadium’s traditional hot dogs that come from the Sheboygan Sausage Company and the Doggie Diner. In other words, AT&T Park has gourmet options right alongside basic ballpark food. Fans seem to like that spread.
And the other stadiums? It shouldn’t surprise anyone that 2 of the top 5 hot dogs are in Chicago. In fact, about 20 percent of the time a reviewer talks about the hot dogs at Wrigley or Guaranteed Rate Field, they specifically reference that it’s a Chicago-style hot dog.
Though Dodger Stadium is only 5th, the Dodger Dog is worth discussing because of how wildly popular it is.
The Dodger Dog has been around since 1958. Fans know it and like it. And they like talking about it. It gets hundreds and hundreds of mentions in stadium reviews. In fact, a reviewer is about 10 times more likely to mention the hot dogs at Dodger Stadium than they are at Milwaukee’s Miller Park.
This may be a lesson for other teams. If you don’t have a team-branded hot dog, get one. Fans are going to buy a ton of hot dogs at your stadium, and by offering them a team-branded hot dog, you’re giving them something beyond the standard sausage. Case in point: the Dodger Dog, the Wrigley Dog, the Rockie Dog, and the Fenway Frank — all in the top ten.
Major League Baseball Stadiums Ranked by Food and Beer
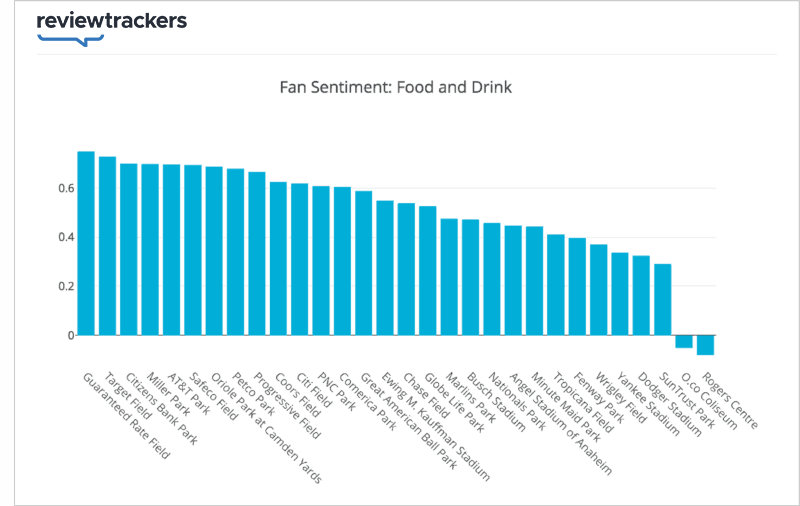
The algorithm flagged 20,000 instances where it had a reasonably high confidence that a reviewer had a positive (or negative) experience with their beer, drinks, food, etc.
Chicago’s Guaranteed Rate comes out on top. Unlike AT&T Park (read: crab sandwiches), the South Side stadium is focused on the basics. The park has Wao Bao, Smoque, and a few other specialty restaurants, but for the most part, reviewers simply praise the mostly traditional stadium food.
Case in point: the Comiskey burger, a double (or triple) quarter pounder cheeseburger topped with chicago-style hot dog condiments.
Because everyone wants to talk about beer, let’s talk about beer.
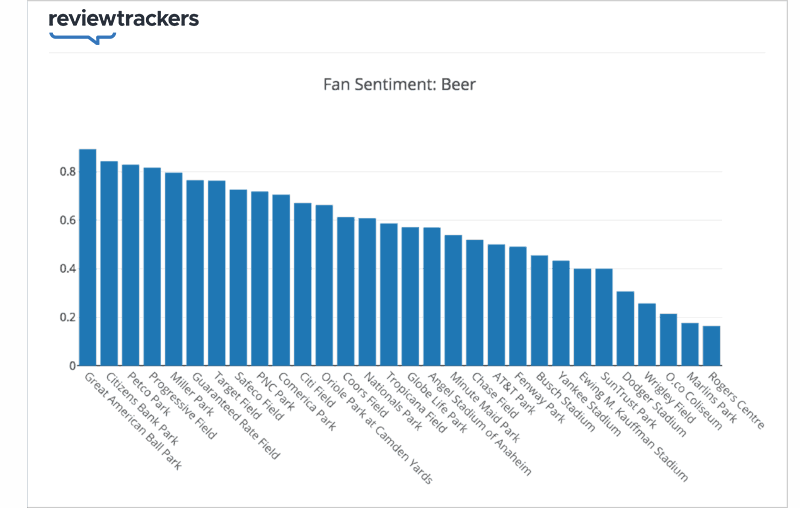
What makes Great American Ball Park so beer-friendly? Selection and craft. Fifteen percent of all “local beer” mentions and 9 percent of all mentions of “beer selection” were in reviews of Great American Ball Park.
Beer snobbery has been a significant trend across all of baseball. The number of times fans mention “beer selection” has grown 24 percent between 2010 and 2016, suggesting that stadiums have been working to keep pace with the craft beer movement.
Can Big Data Tell You What to Eat at a Baseball Stadium?
Yes, yes it can.
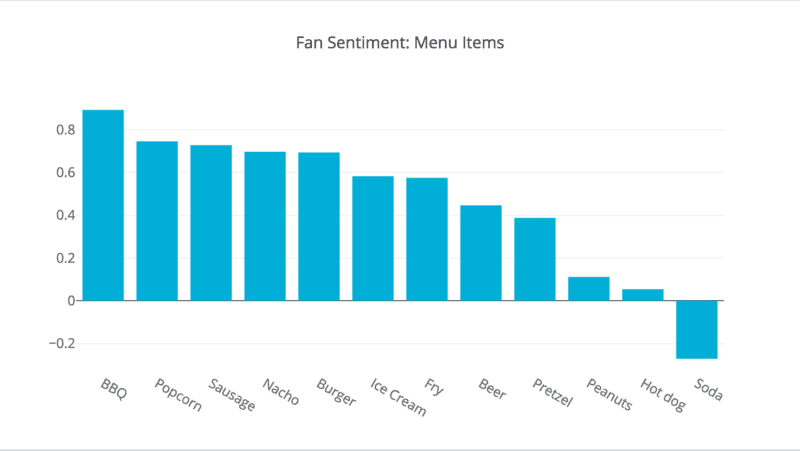
Bingo. BBQ.
With all do respect to the hot dog — it *is* the prototypical ballpark food — these sentiment scores show us that fans talk much more highly of their barbecue, popcorn, sausage, nachos, and burgers. In fact, the average sentiment for a reviewer talking about barbecue is about 4 times greater than that of hot dogs.
The lesson: venture out. Try a burger, barbecue, or nachos next time.
Major League Baseball Stadiums Ranked by Fan Experience
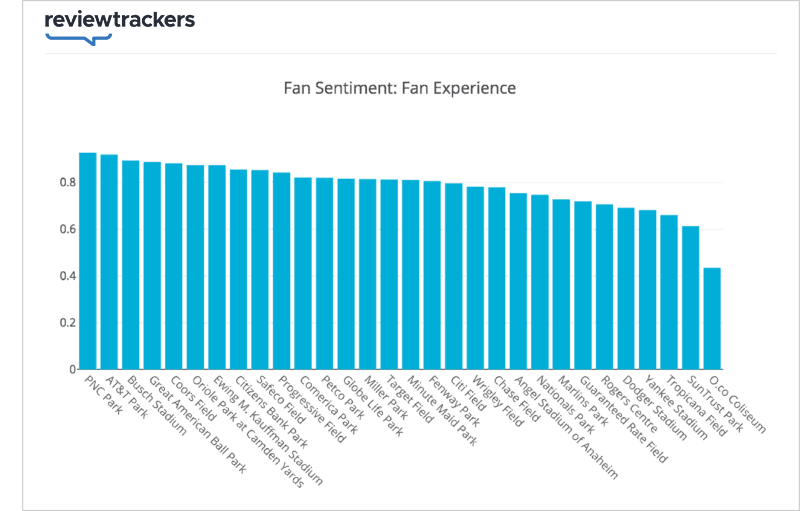
By “fan experience,” we mean things like a fan’s seats, the scoreboard, sightlines, atmosphere, crowd, history, and other parts of a stadium’s ambiance.
Given that the highest possible score is 1, it’s remarkable how well the top stadiums do.
The high score for PNC Park isn’t really surprising. Fans generally rave about the stadium. One reason is the view.
Fans talk about the view at PNC 6 times more often than at the average stadium, and twice as often as the next highest stadium (AT&T Park). But even if you exclude discussion about the views, AT&T and PNC still come out on top for fan experience.
Initially, we’d figured that keywords about the culture and history of the team would carry more weight in iconic stadiums like Yankee Stadium, Wrigley, and Fenway. But fans don’t talk about that as much as you’d think.
Consider this: 13 percent of stadium reviews for Fenway mention the tour, museum, or history of the ballpark, but only 6 percent do so for Wrigley and only 3 percent do so for Yankee Stadium. By contrast, the view is a topic of conversation in 16 percent of PNC’s reviews. In other words, fans are 4 times more likely to talk about the view at PNC than they are to mention the parts of Yankee Stadium that speak to the team’s tradition, culture, and history.
You may be noticing that classic stadiums like Wrigley Field and Fenway Park haven’t rated highly. But ask anyone for a list of top stadiums and these two will come up.
It suggests there’s a disconnect between the way fans review these stadiums, the experiences the stadiums offer, and their reputations. If you’re curious, jump down to the section where we discuss why fans may judge these classic stadiums differently.
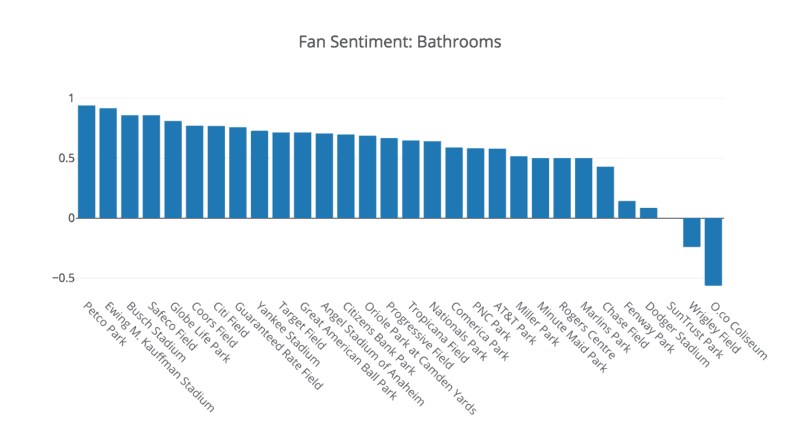
Major League Baseball Stadiums Ranked by Facility
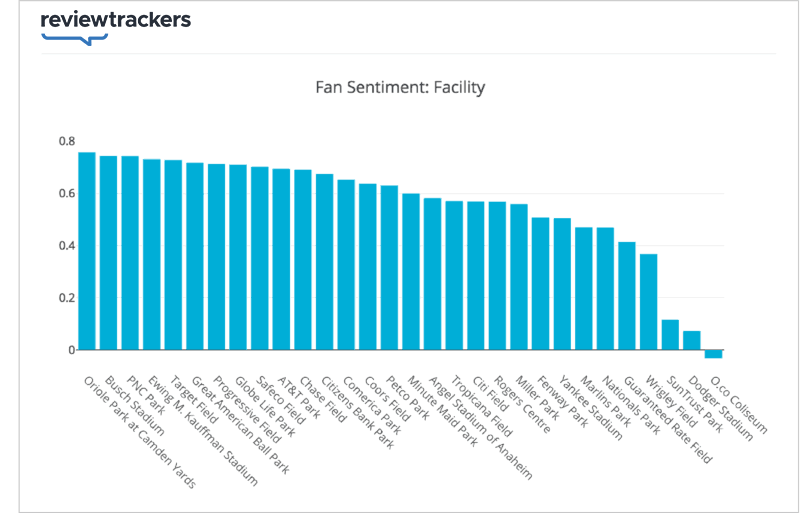
For the facility score, we tracked the sentiment behind things like parking, neighborhood, transit, bathrooms, accessibility, and customer service.
One shocker from this graph is that SunTrust Park, a brand new stadium, isn’t scoring well for its facility. In its online reviews, fans have mentioned the parking 112 times — and most of these mentions have been negative.
The reason may be that while SunTrust expanded parking over Turner Field, it has a system of prepaid and non-prepaid parking lots that fans haven’t figured out yet.
Some tailgating Atlanta fans have come early to games, only to find that they’re not allowed to park in their prepaid spot yet. Some lots only open an hour before the game, while others open 4 hours before. Other fans have complained that despite the fact that they’ve prepaid for parking, it still takes them an hour to actually find their spot and park in it.
On the flip side, Oriole Park at Camden Yards is tops.
What does Baltimore do well? A lot of things. For any of the particular facility keywords, it generally ranks in the top ten. In particular, people love the neighborhood (Inner Harbor) and there are a number of positive mentions about the staff.
Here’s one typical review:
Beautiful ball park with some of the nicest and the most enthusiastic staff I have ever seen!
And another:
Extremely friendly and helpful staff. It’s an easy walk from the Inner Harbor/Downtown Baltimore.
One of the interesting things about customer experience data like this is that it highlights things that often go overlooked or are hard to quantify. Everyone wants their staff to be gracious and nice, but there is something Baltimore is actually doing — training, managing, recruiting — which leaves people with a good experience with its staff and service.
One last point to note: fans respond to renovations. This graph shows the facility scores for Wrigley Field and Dodger Stadium over time.
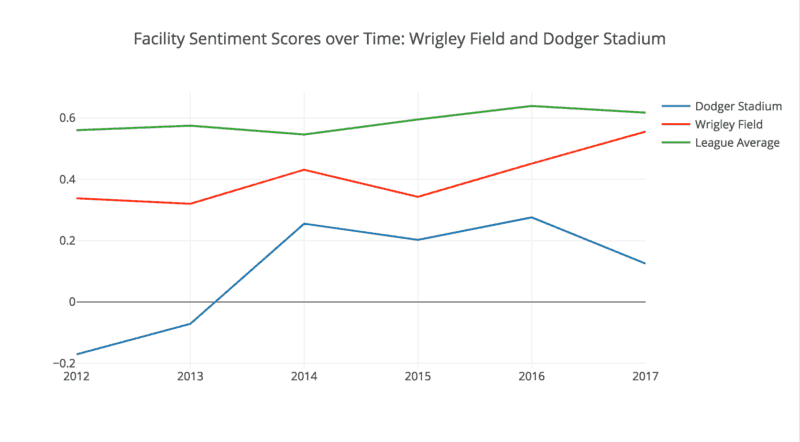
Dodger Stadium began renovations in 2012 and Wrigley underwent renovations in 2014 and 2015. While these two older stadiums still score below average, they’ve made steady improvements.
Major League Baseball Stadiums Ranked by Family Friendliness
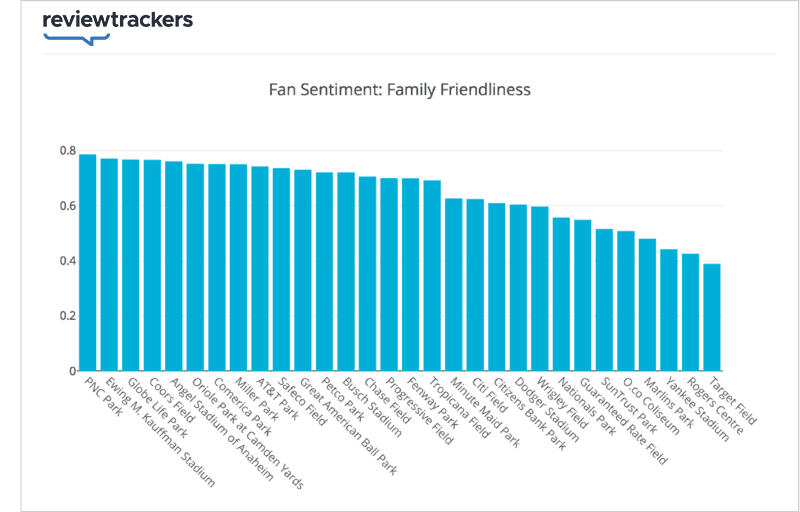
If you’re taking your family to the game, you’ll want a friendly environment, free activities, and lower prices.
So we tracked how people talked about cost, giveaways, security, activity areas, and whether or not they actually mentioned going to the game with their mom, dad, daughter, or son. We also tracked mentions of drunk fans and drunkenness — a common complaint among families.
The winners: Kansas City’s Kauffman Stadium and Pittsburgh’s PNC Park.
What do they do well? As it turns out, every Sunday at Kauffman is “Family Funday Sunday” with face painters and free pre-game entertainment. Similarly, Pittsburgh has “Kids Days” on Sunday with special kid friendly giveaways. PNC park let’s kids run the bases after every Sunday game.
Here’s one Pittsburgh reviewer praising the experience:
My family attends Pittsburgh Pirates games several times during the season. PNC Park is very well maintained and clean. […] If you go at the right time, you could see a concert or fireworks after the game. On Mother’s day I got to run the bases with my son. Fun! Let’s Go Bucs!
Take your kid to the game ☑
Mother and son run the bases ☑
Nice work, Pittsburgh.
Trends in Fan Sentiment over Time
Before we look at each stadium more closely, it’s helpful to talk about overall trends in baseball.
Trend #1: Fan Sentiment Increased 17 percent over Last 7 Years
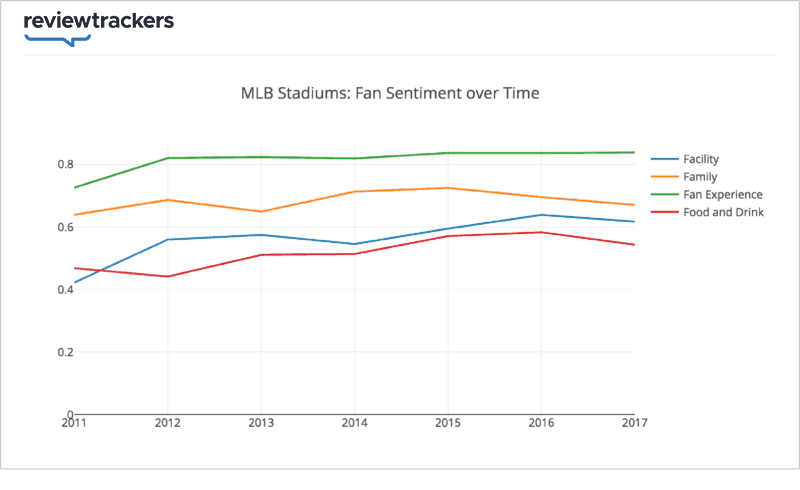
Over the last seven years, fan sentiment for all the aspects of a stadium we tracked increased a combined 17 percent.
While you would expect stadiums to get better over time, remember that we’re measuring sentiment. In other words, we aren’t measuring whether teams added better jumbotrons. We’re measuring whether fans are walking away from the stadium satisfied with bigger and better jumbotrons. And they are. Nostalgia be damned.
While there has been talk about the slow pace of baseball games and MLB’s struggle to match the NFL’s growth, at least as far as in-stadium experience goes, MLB fans have been more satisfied with their experiences in recent years.
Trend #2: the Hot Dog Isn’t the Sandwich You Should Be Worried about
Okay, we already talked about food, but let’s go back to the burger.
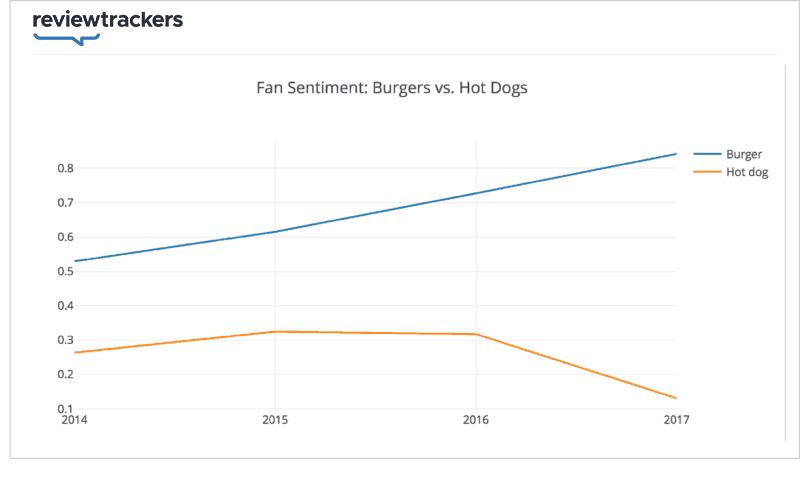
Burgers still only appear in one-tenth of the amount of the reviews as hot dogs, but fan sentiment for them has grown 60 percent in the last four years. Other menu items like beer, barbecue, and nachos have hovered around their historic norms.
The Cathedral Effect: Wrigley Field and Fenway Park
This analysis has two obvious outliers: Fenway Park and Wrigley Field. These are the only stadiums that have above average star ratings and below average sentiment scores.
According to star rating these are top stadiums, but when people talk about the stadium experience, they don’t do so in glowing terms. The words they use are much, much less likely to be positive than at Camden Yards, AT&T Park, or PNC.
There are a couple explanations for this disparity.
First, there’s the marketing explanation. Fans at Wrigley and Fenway Park are going there for a premium experience. These stadiums have a different value proposition: history, tradition, and the experience of a so-called “baseball cathedral.”
That’s a different type of product than, say, Houston’s Minute Maid Park, where the Astros have a train that choo-choos every time there’s a home run.
Other stadiums have to sell a general ballpark experience: food, entertainment, and a day out. Those standards don’t apply to Wrigley and Fenway. When you’re at Wrigley, it doesn’t matter that the men’s rooms use the “trough” system. What matters is that the ballpark was built in 1914 and that the ivy turns red in October.
Another explanation may have to do with fan psychology. Dr. Jennifer Coane, psychology professor at Colby College, explained that these stadiums may be more strongly aligned with the team and city’s identity. For a fan to give a low rating to Wrigley would be verboten, because it would feel like an insult to the Cubbies and to Chicago, in general. Coane hypothesized that this effect could be stronger at Wrigley and Fenway.
While it’s hard to measure, there is some data that backs up Coane’s hypothesis. Reviews at Wrigley and Fenway are much more likely to include mentions of the name of the team. As Coane suggests, fans may conflate the value of the stadium and the team in a way that doesn’t happen elsewhere.
In addition, there could be a number of other possible biases: sunk cost fallacy, cognitive dissonance, or endowment bias. Coane, who researches the cognitive biases associated with memory, explained, “After having paid (sometimes a lot of money) for tickets, one will rate the experience as positive as a way of justifying the cost. However, this positivity extends only to the global experience, not the specific aspects of the experience.”
We see this disconnect in a number of reviews:
There’s nothing like Fenway. I could care less that the tickets are expensive, the beer is overpriced, or the bathrooms are a nightmare. I’ve never had a bad time there. I love it and can’t wait to go again!
This highlights the different challenges each stadium staff faces. New stadiums have to focus on innovation. Kauffman Stadium shells out for the world’s largest HD scoreboard. And the chefs at Chase Field dream up the “churro dog,” an ice-cream and Oreo covered churro on a donut bun. Meanwhile, the staffs at Fenway and Wrigley focus their efforts on preservation and restoration.
Every MLB Stadium’s Fan Sentiment
1. Oriole Park at Camden Yards
Facility rank: 1
Family rank: 6
Fan experience rank: 6
Food and drink rank: 7
Overall rank: 1
Baltimore’s Camden Yards ranks tops overall and we’ve already praised its staff — but one thing that you may not know is that fans really like its barbecue.
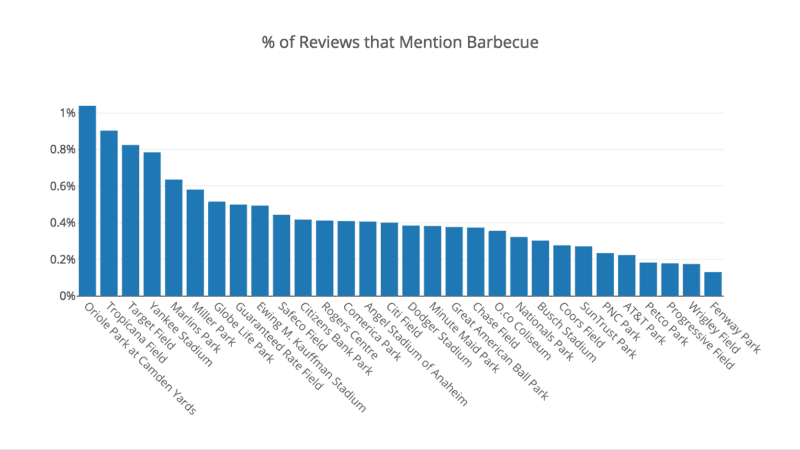
Thank Boog’s Barbecue for that. Since Camden Yards opened 25 years ago, the one-time AL MVP, Boog Powell, has been dishing out brisket at O’s games. And now his barbecue is the most popular in baseball – more popular than BBQ in Kansas City or either of the two Texas stadiums.
Maybe that makes sense. If you buy barbecue from a guy named “Boog,” you’re going to enjoy it.
2. PNC Park
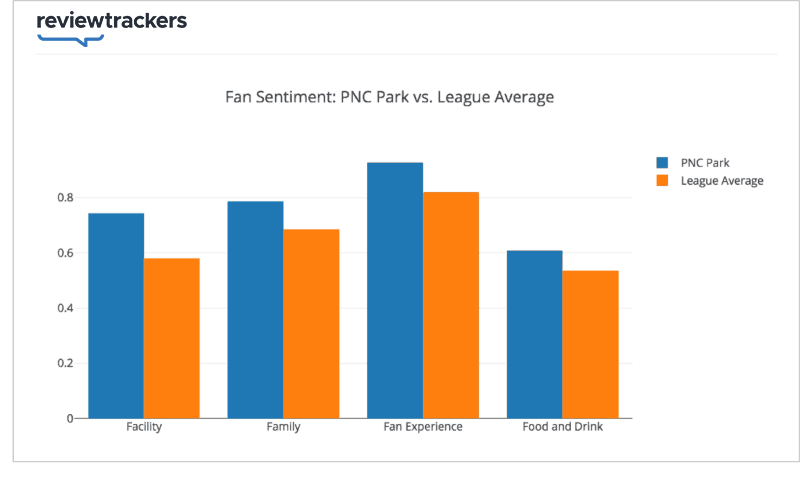
Facility rank: 3
Family rank: 1
Fan experience rank: 1
Food and drink rank: 12
Overall rank: 2
3. AT&T Park
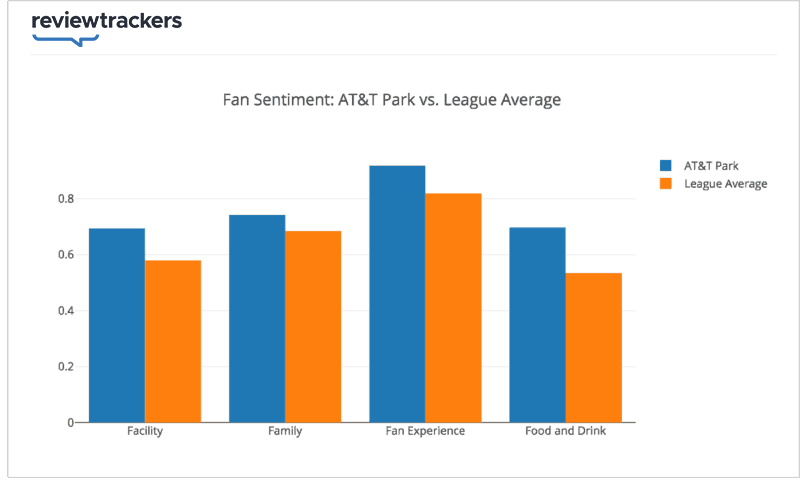
Facility rank: 10
Family rank: 9
Fan experience rank: 2
Food and drink rank: 5
Overall rank: 3
4. Safeco Field
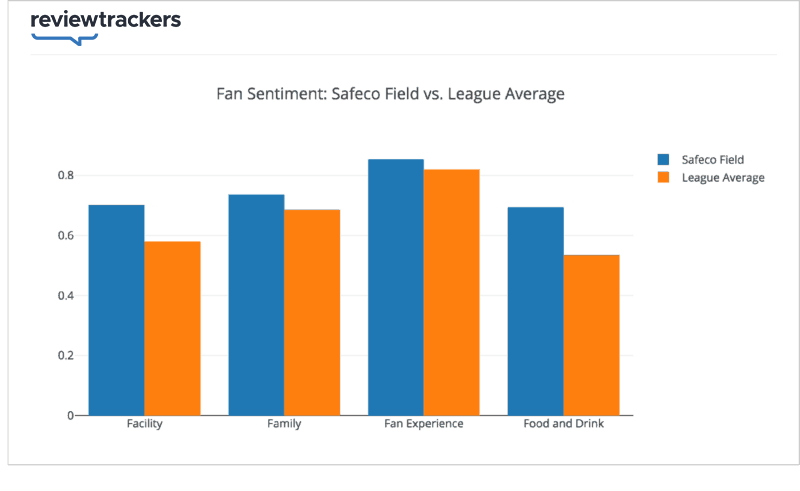
Facility rank: 9
Family rank: 10
Fan experience rank: 9
Food and drink rank: 6
Overall rank: 4
5. Ewing M. Kauffman Stadium
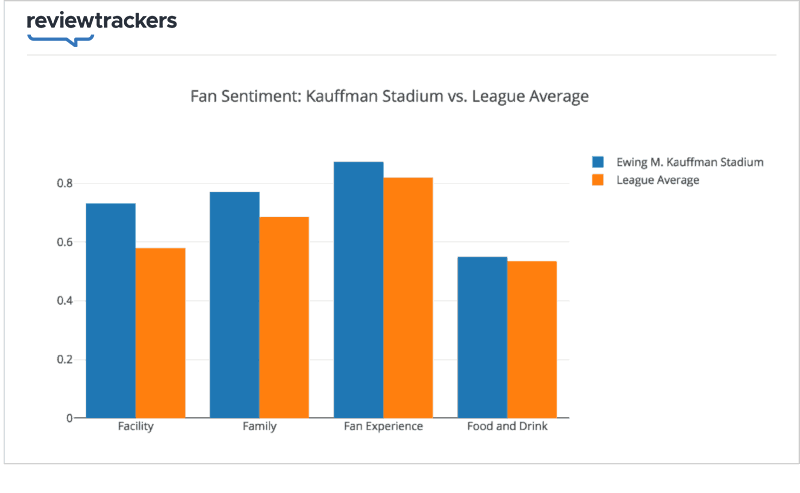
Facility rank: 4
Family rank: 2
Fan experience rank: 7
Food and drink rank: 15
Overall rank: 5
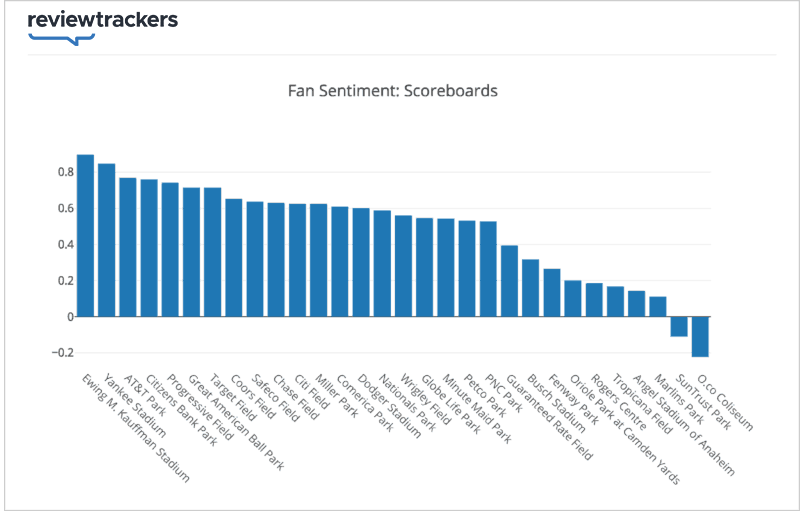
Kauffman Stadium features a 100 by 85 feet jumbotron, known as “Crown Vision.” It’s topped by a light-up crown, and at the time of its installation in 2007, it was the largest HD scoreboard in the world. Needless to say, fans really like it:
6. Great American Ball Park
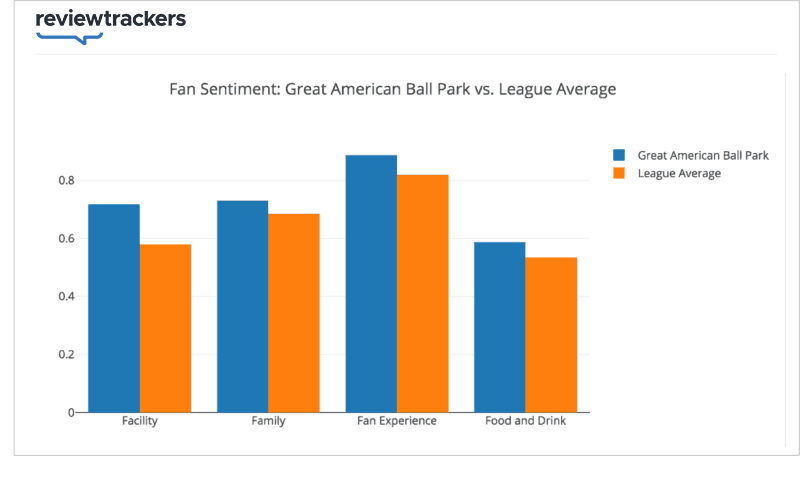
Facility rank: 6
Family rank: 11
Fan experience rank: 4
Food and drink rank: 14
Overall rank: 6
7. Progressive Field
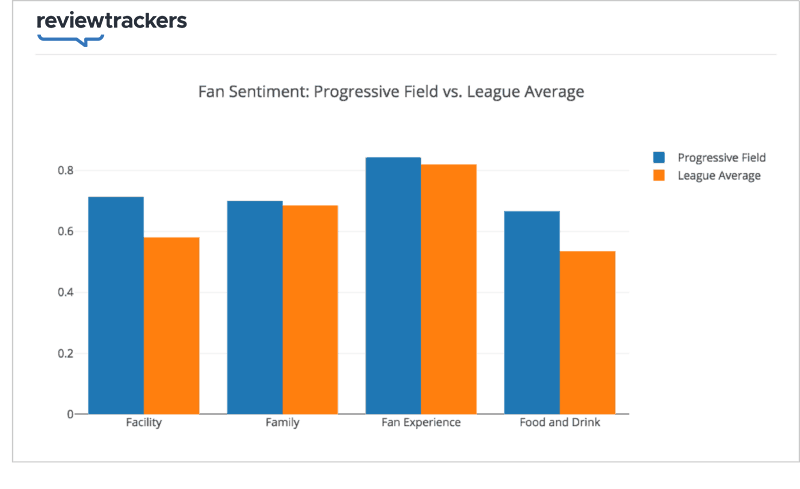
Facility rank: 7
Family rank: 15
Fan experience rank: 10
Food and drink rank: 9
Overall rank: 7
If you’re in Cleveland, the thing to do, apparently, is eat ice cream:
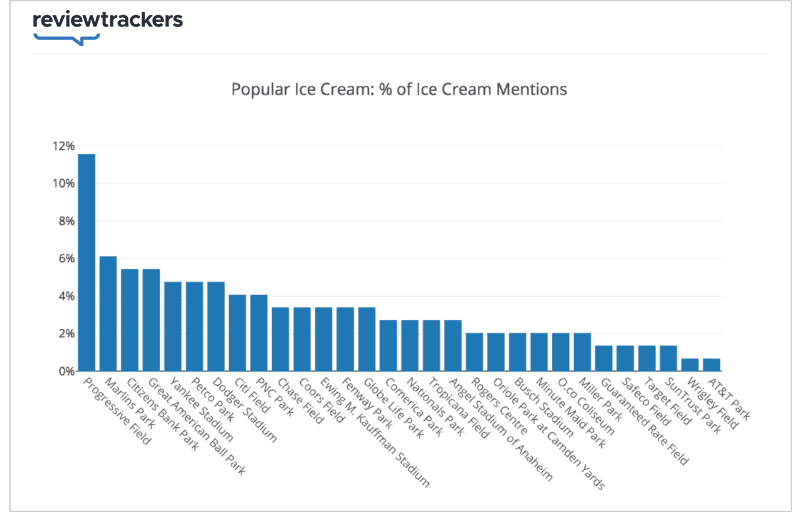
Progressive Field has almost twice the amount of mentions of ice cream as the next stadium. The reason is Pierre’s, a local Cleveland ice cream brand that has been in operation since 1932.
The most popular flavor we saw mentioned by name was “Moose Tracks,” so be ready for peanut butter cups in your ice cream.
8. Coors Field
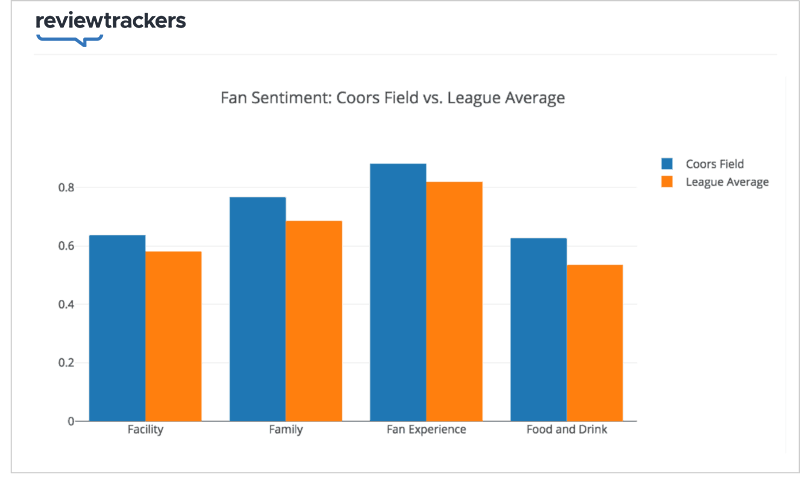
Facility rank: 14
Family rank: 4
Fan experience rank: 5
Food and drink rank: 10
Overall rank: 8
9. Petco Park
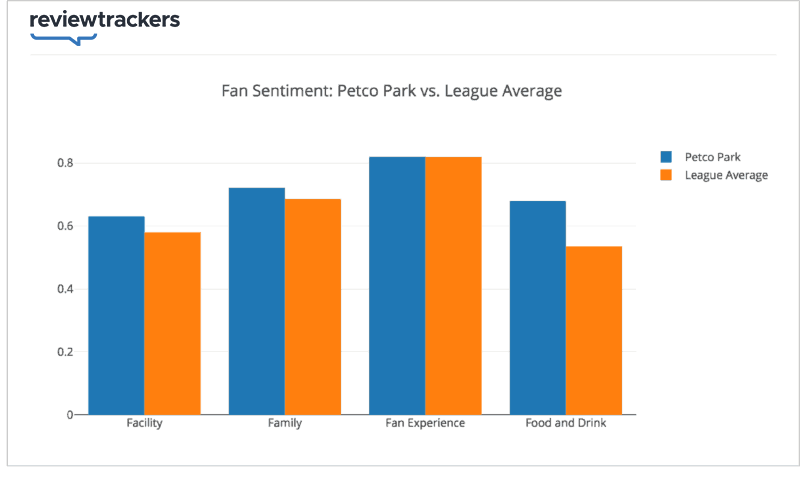
Facility rank: 15
Family rank: 12
Fan experience rank: 12
Food and drink rank: 8
Overall rank: 9
Congratulations, Padres fans, your bathrooms are the best the baseball:
10. Citizens Bank Park
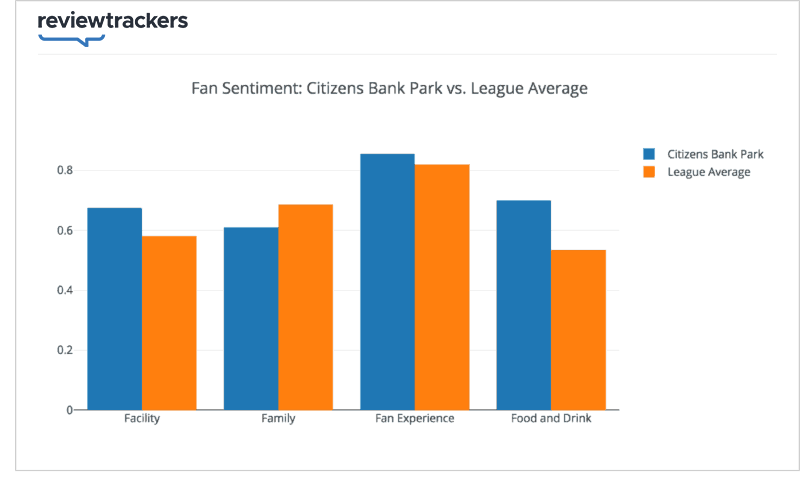
Facility rank: 12
Family rank: 20
Fan experience rank: 8
Food and drink rank: 3
Overall rank: 10
11. Busch Stadium
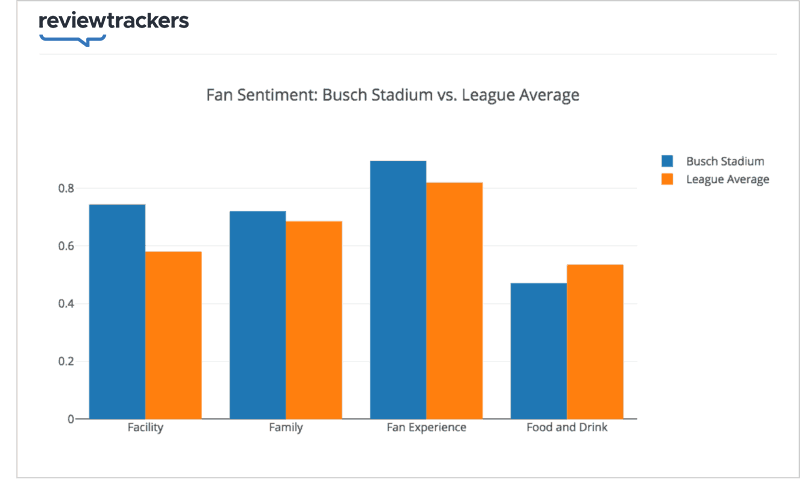
Facility rank: 2
Family rank: 13
Fan experience rank: 3
Food and drink rank: 19
Overall rank: 11
You’ll hear people tell you that the Cardinals fans are the best fans in baseball.
You’ll hear that a lot.
Sometimes from Cardinals fans themselves.
So we wanted to check the review data. As it turns out, fans at Busch are 12 times more likely to describe themselves as “the best fans” compared to the typical team’s fans.
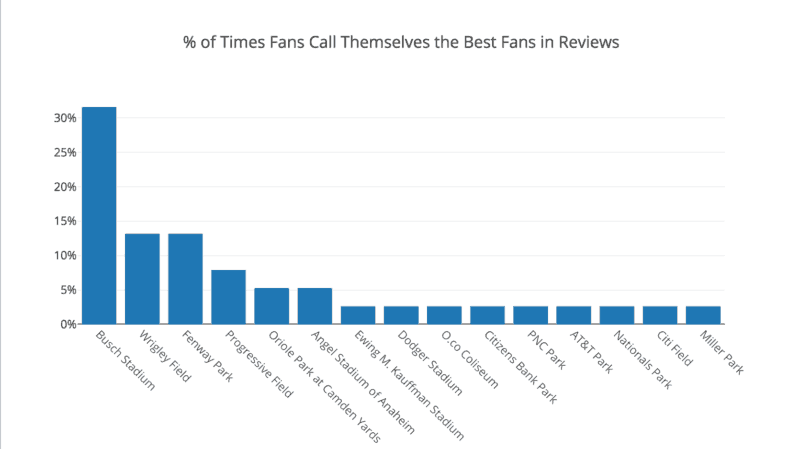
To be fair, we should also check the sentiment scores every time someone mentioned the crowd at a stadium:
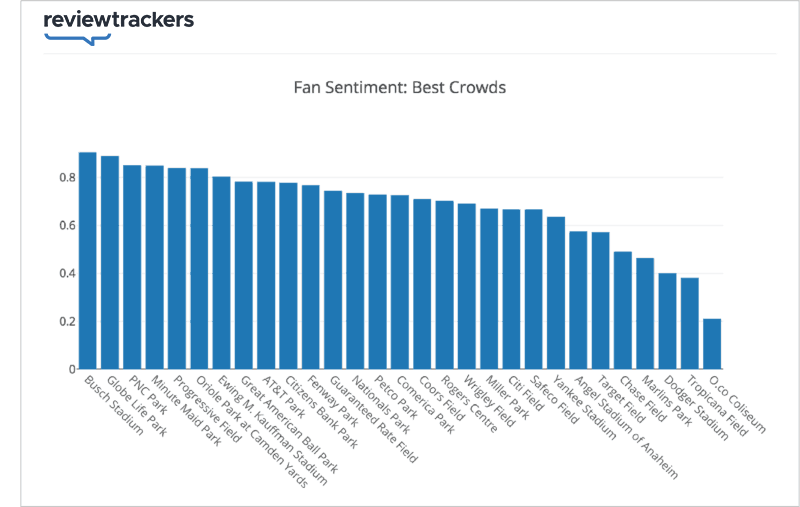
As it turns out, people really do talk about the crowd at Busch more positively than at any other stadium.
12. Comerica Park
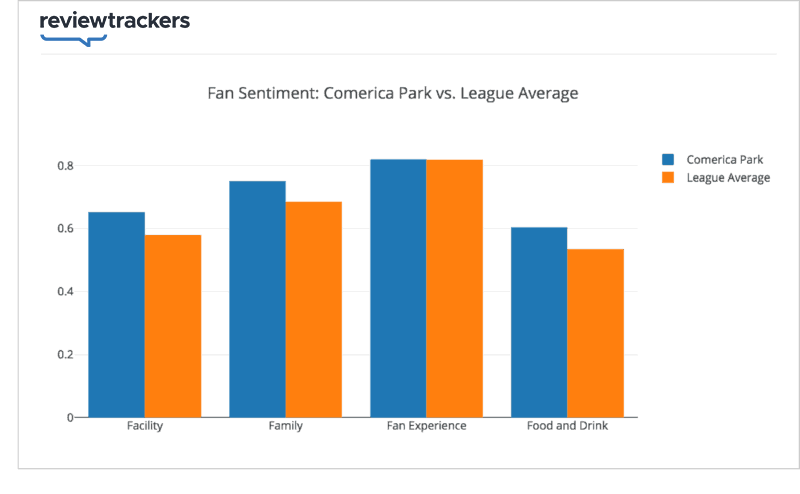
Facility rank: 13
Family rank: 7
Fan experience rank: 11
Food and drink rank: 13
Overall rank: 12
It may sound silly, but one of the things Tigers fans really enjoy is the entrance to the stadium, which features giant statues of tigers, tiger gargoyles, and large photos of Ernie Harwell and Ty Cobb. For what it’s worth, more fans talk about the entrance at Comerica than the entrance at Wrigley (and its iconic “Home of Chicago Cubs” sign).
Comerica also has a perfect score for its staff. In all 160 times our algorithm flagged a mention of Comerica Park’s staff, a reviewer was talking about them positively.
13. Miller Park
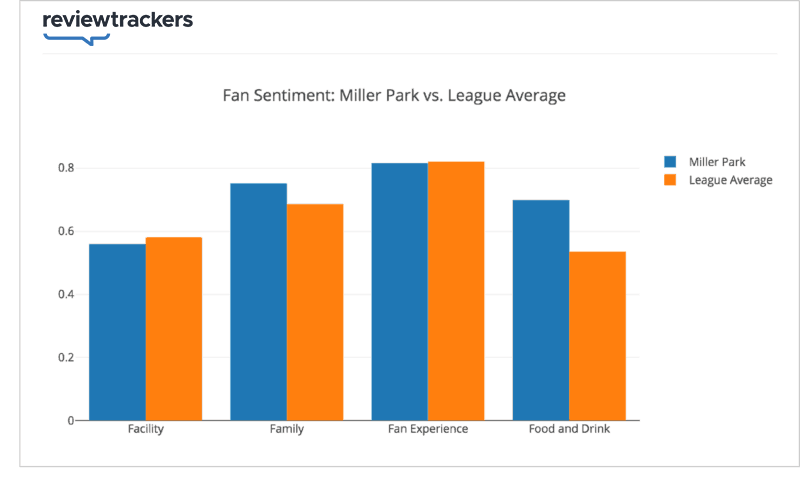
Facility rank: 21
Family rank: 8
Fan experience rank: 14
Food and drink rank: 4
Overall rank: 13
In what will come as no surprise to anyone who has crossed the Wisconsin state border, Miller Park has the most mentions of Sausage.
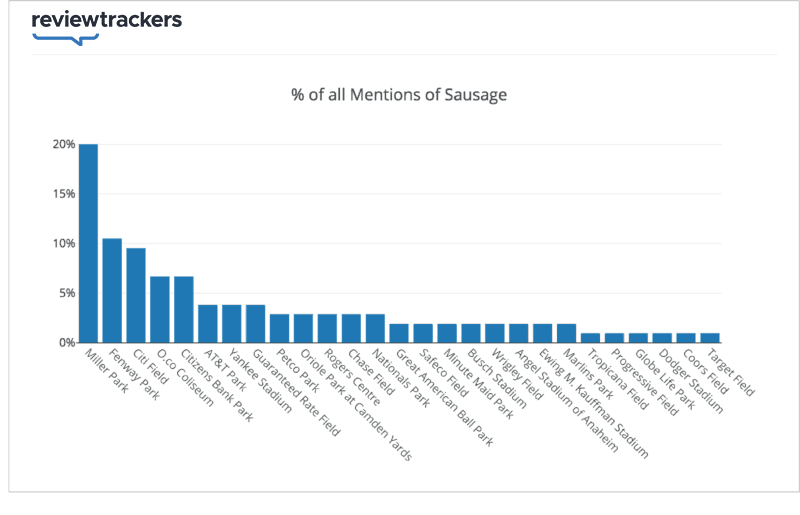
Note: this is only food-related mentions of sausage. All sausage race mentions were left out.
14. Globe Life Park
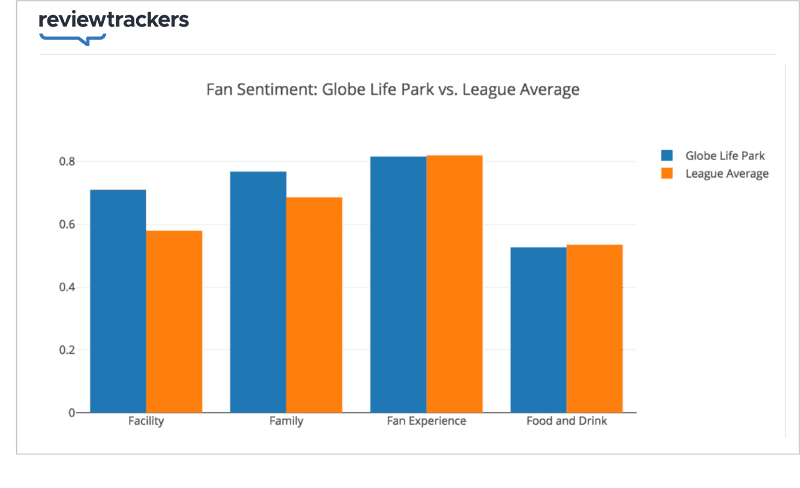
Facility rank: 8
Family rank: 3
Fan experience rank: 13
Food and drink rank: 17
Overall rank: 14
15. Chase Field
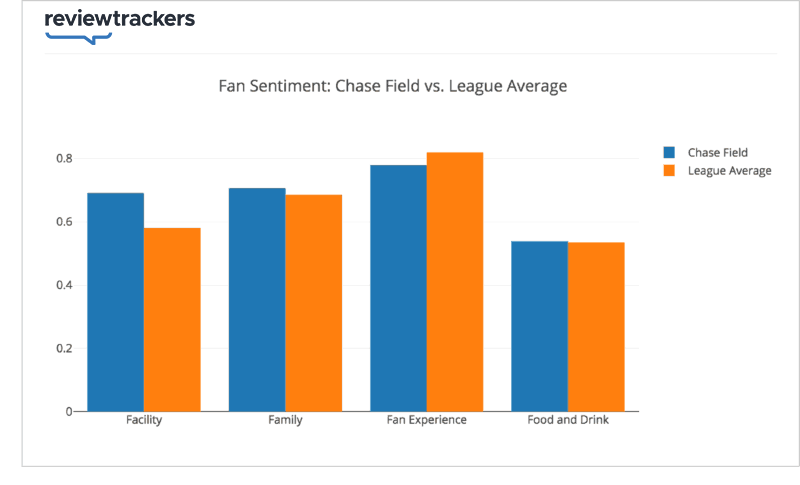
Facility rank: 11
Family rank: 14
Fan experience rank: 20
Food and drink rank: 16
Overall rank: 15
16. Target Field
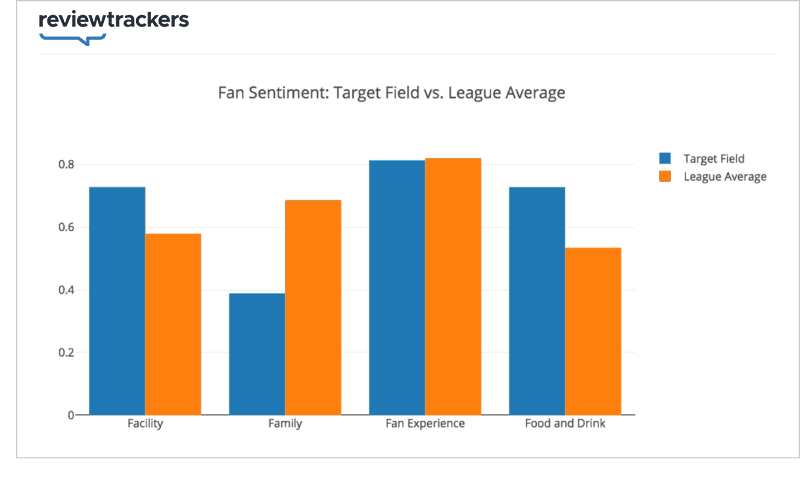
Facility rank: 5
Family rank: 30
Fan experience rank: 15
Food and drink rank: 2
Overall rank: 16
Target Field’s staff score very highly (.98 vs. league average of .90) so perhaps there is something to the whole Minnesota nice thing.
17. Citi Field
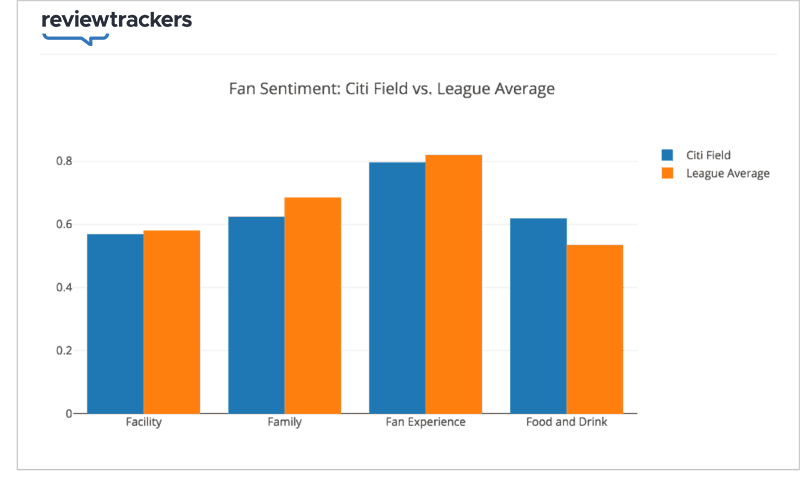
Facility rank: 19
Family rank: 19
Fan experience rank: 18
Food and drink rank: 11
Overall rank: 17
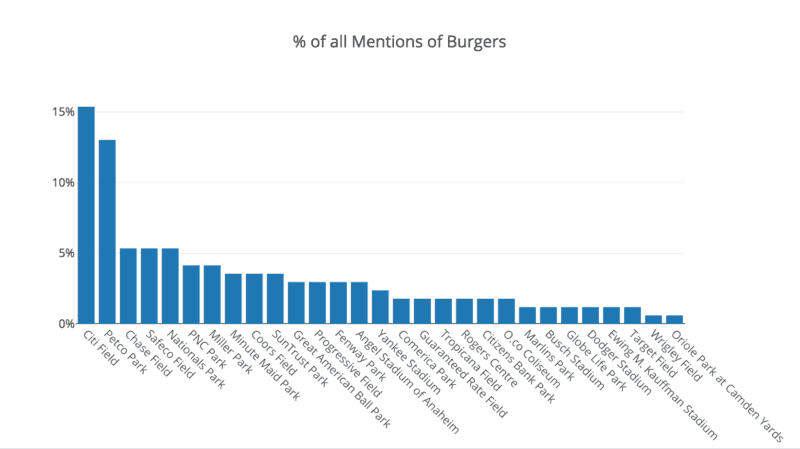
Citi Field boasts the most popular burgers in baseball. In fact, it accounts for 15% of all burger mentions, likely due to the popularity of Shake Shack at Citi Field.
18. Angel Stadium of Anaheim
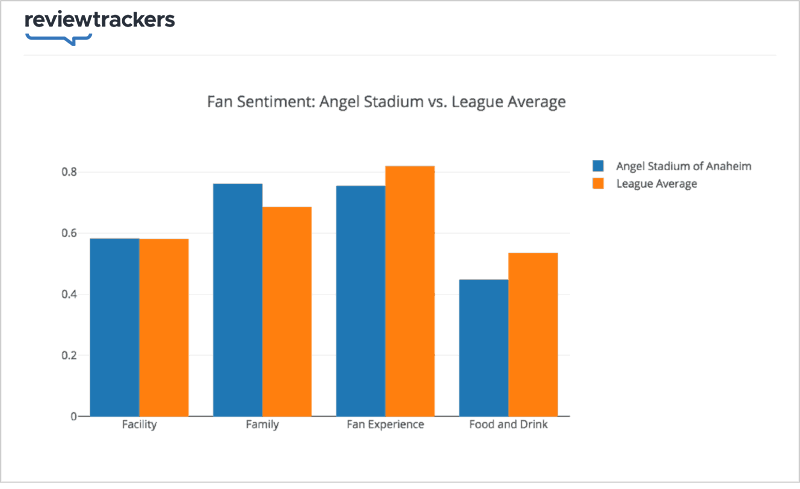
Facility rank: 17
Family rank: 5
Fan experience rank: 21
Food and drink rank: 21
Overall rank: 18
19. Minute Maid Park
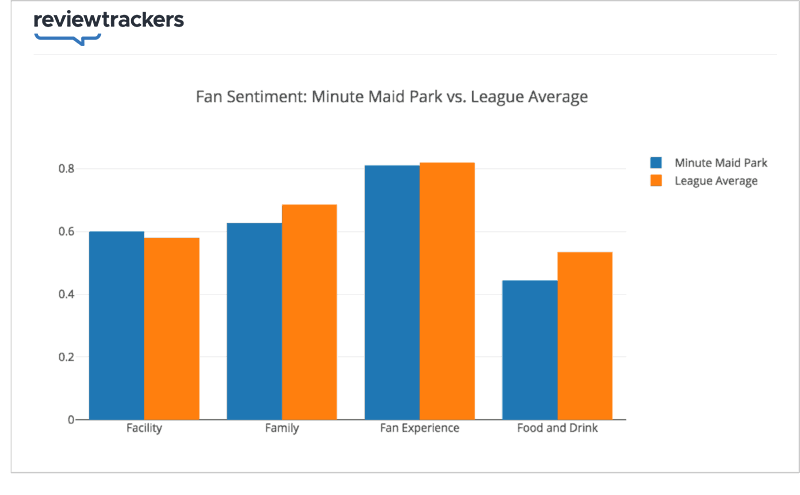
Facility rank: 16
Family rank: 18
Fan experience rank: 16
Food and drink rank: 22
Overall rank: 19
20. Guaranteed Rate Field
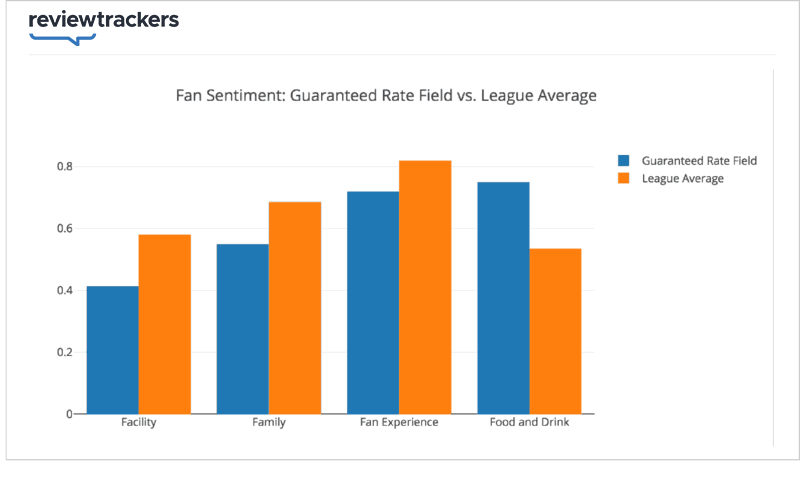
Facility rank: 26
Family rank: 24
Fan experience rank: 24
Food and drink rank: 1
Overall rank: 20
As we covered above, Guaranteed Rate has the top-rated food in MLB, 40% better than average. This is remarkable simply because food, in general, has lower sentiment scores than any other part of the stadium experience.
That isn’t to say that food at stadiums is bad. Likely, what we’re seeing is that fans are more critical about food than other parts of the stadium experience.
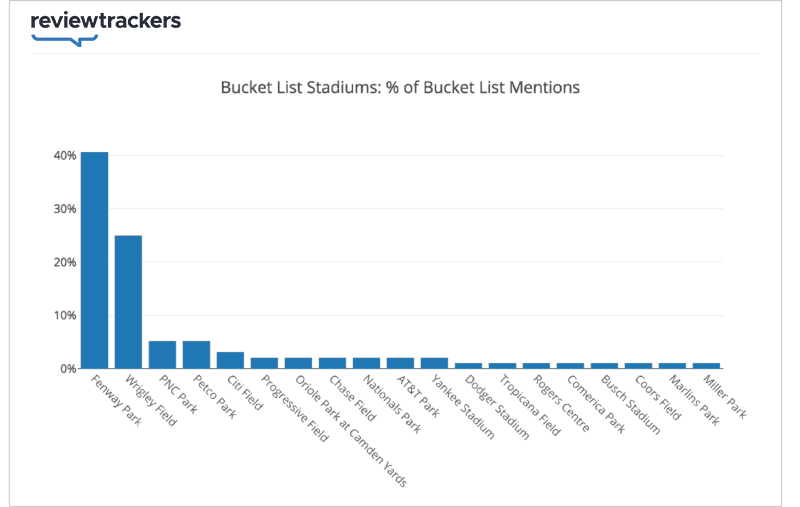
21. Fenway Park
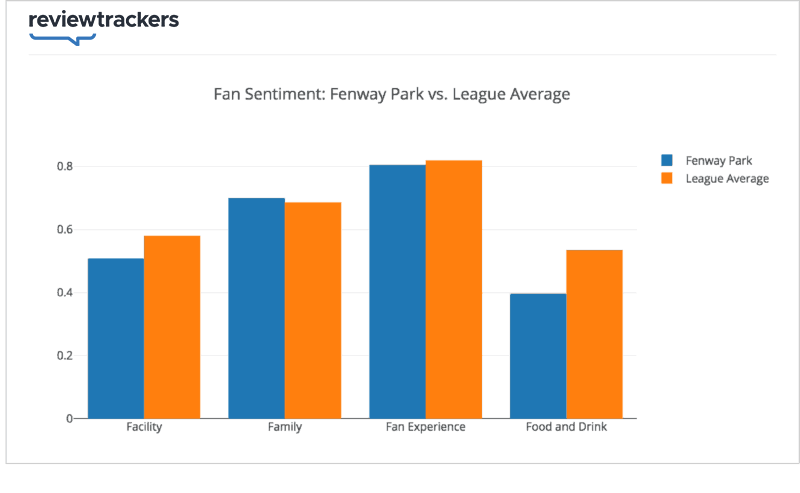
Facility rank: 22
Family rank: 16
Fan experience rank: 17
Food and drink rank: 24
Overall rank: 21
There are a couple of ways Fenway stands out compared to other stadiums.
First, is its tour. Fenway gets three times more mentions of a tour than Wrigley Field, and way more than any other stadium.
Second, it’s the most likely stadium for fans to mention it’s on their “bucket list.”
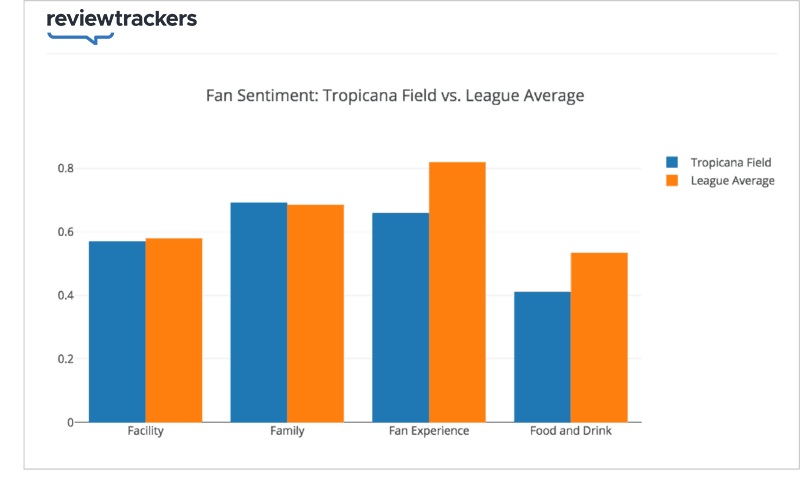
22. Tropicana Field
Facility rank: 18
Family rank: 17
Fan experience rank: 28
Food and drink rank: 23
Overall rank: 22
One the most common complaints fans have with the Trop is the dome (a just barely negative sentiment score -.04).
Fans also are critical about its location. Tropicana Field is located outside of Tampa, and many have suggested that this distance causes low attendance at Rays’ games. Sure enough, Tropicana Field scores 76% below league average for its location (.212 sentiment score vs. league average of .885.)
23. Nationals Park
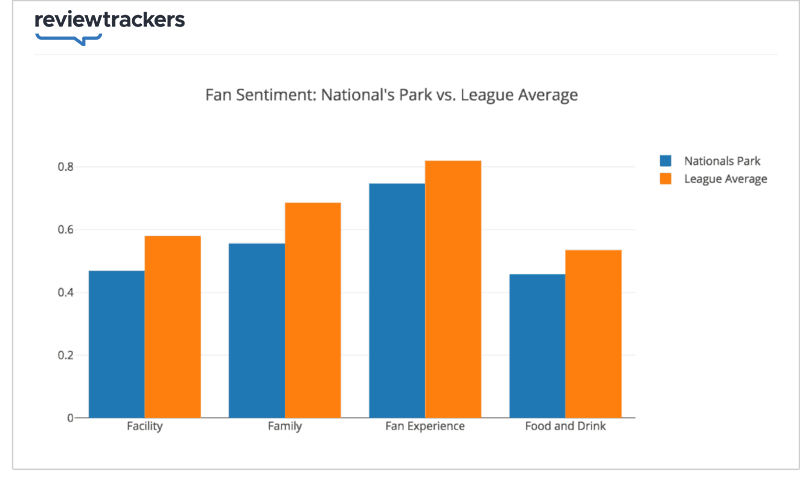
Facility rank: 25
Family rank: 23
Fan experience rank: 22
Food and drink rank: 20
Overall rank: 23
This may not be the *most* statistically significant finding, but we checked which stadiums had the most mentions of bros:
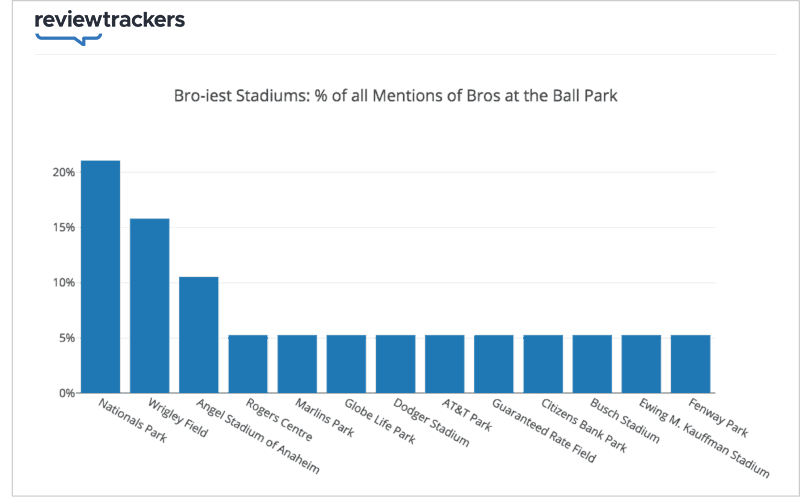
Nats fans, the trophy is all yours.
24. Marlins Park
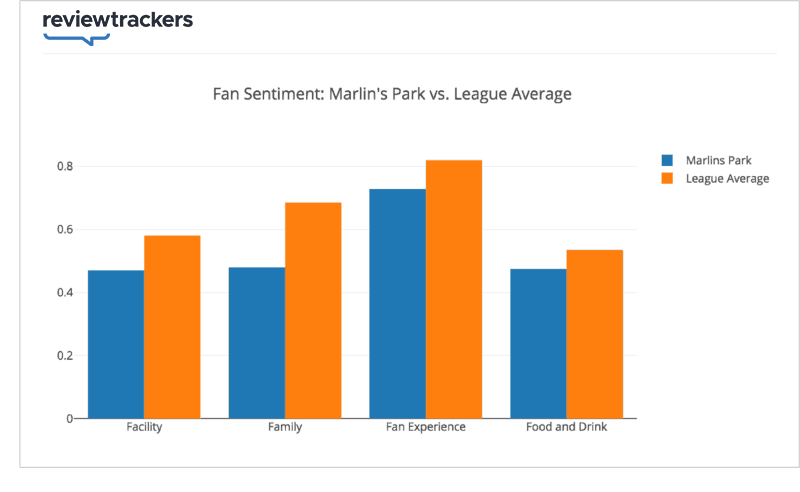
Facility rank: 24
Family rank: 27
Fan experience rank: 23
Food and drink rank: 18
Overall rank: 24
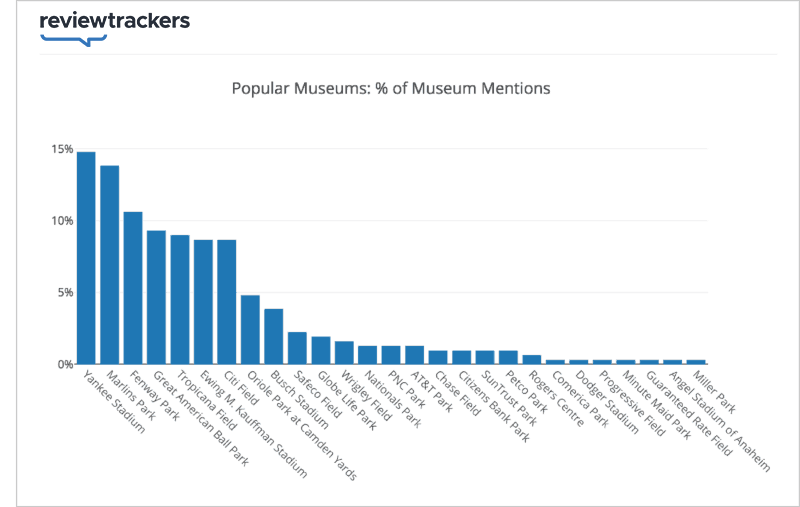
Forget the fountain, the best part of Marlin’s Park is probably the bobblehead museum which is the second most popular museum in reviews.
25. Wrigley Field
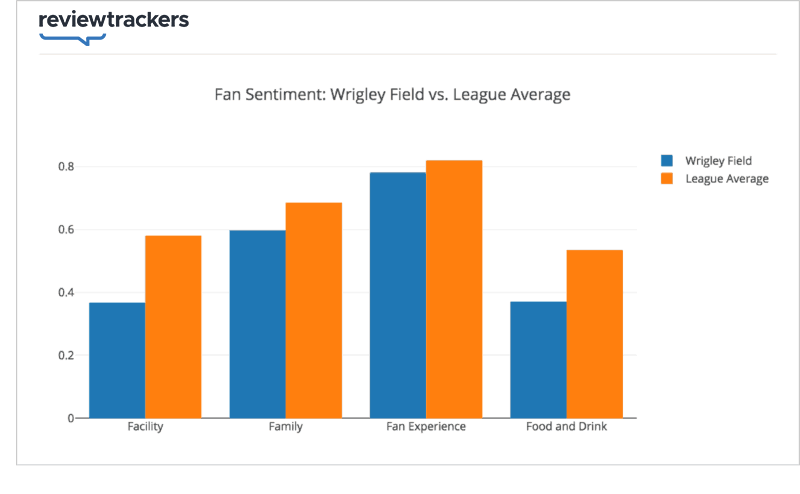
Facility rank: 27
Family rank: 22
Fan experience rank: 19
Food and drink rank: 25
Overall rank: 25
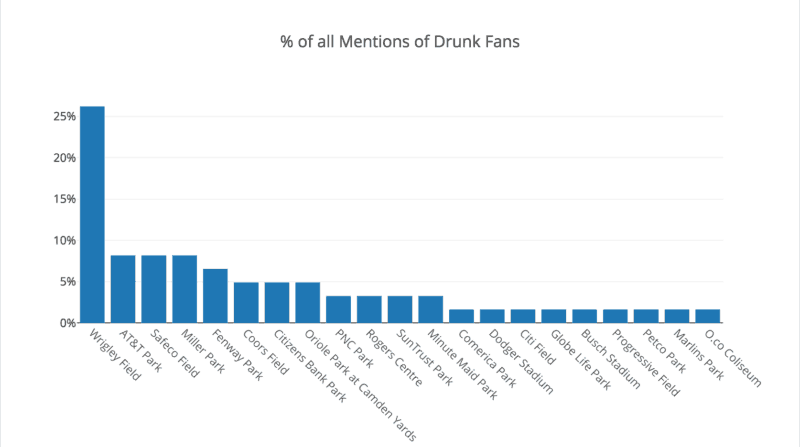
There’s no easy way to say this: Wrigley’s fans are the drunkest. By far.
Wrigley’s reviews are 8 times more likely to have someone complain about drunken behavior than the typical stadium.
26. Yankee Stadium
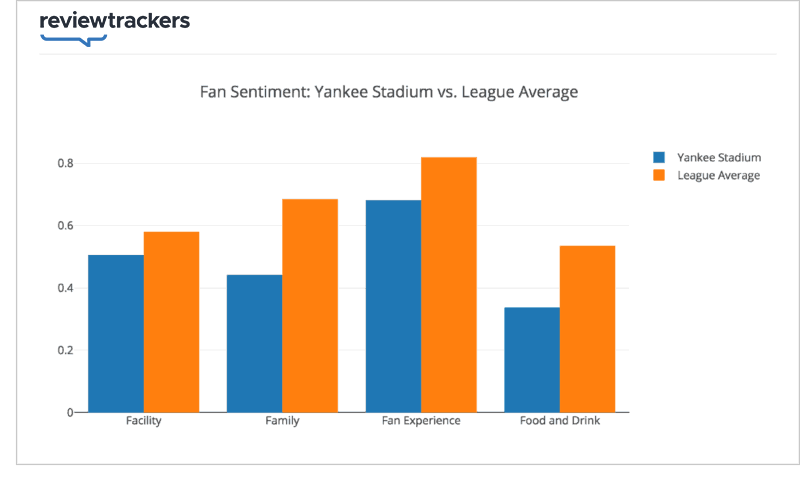
Facility rank: 23
Family rank: 28
Fan experience rank: 27
Food and drink rank: 26
Overall rank: 26
When the Yankees moved from the House that Ruth Built to the house Steinbrenner built across the street, there was concern they’d lose some connection to its history. While its reviews have below average sentiment scores across the board, the Bronx Bombers still boast the most popular museum:
27. Dodger Stadium
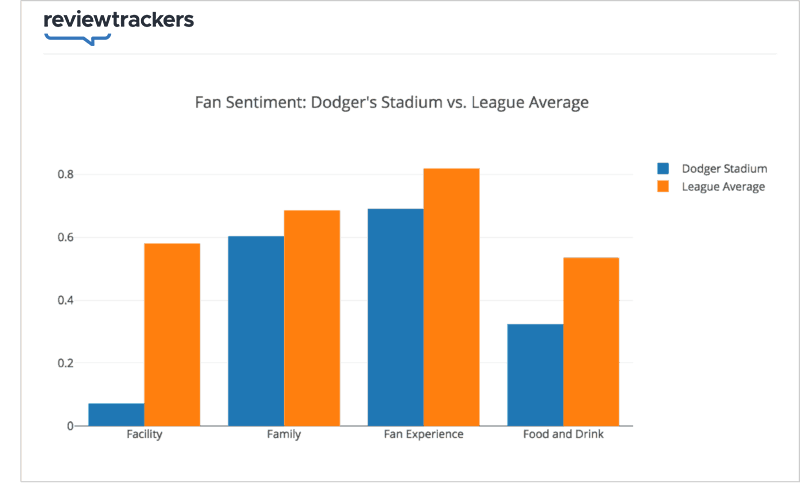
Facility rank: 29
Family rank: 21
Fan experience rank: 26
Food and drink rank: 27
Overall rank: 27
28. Rogers Centre
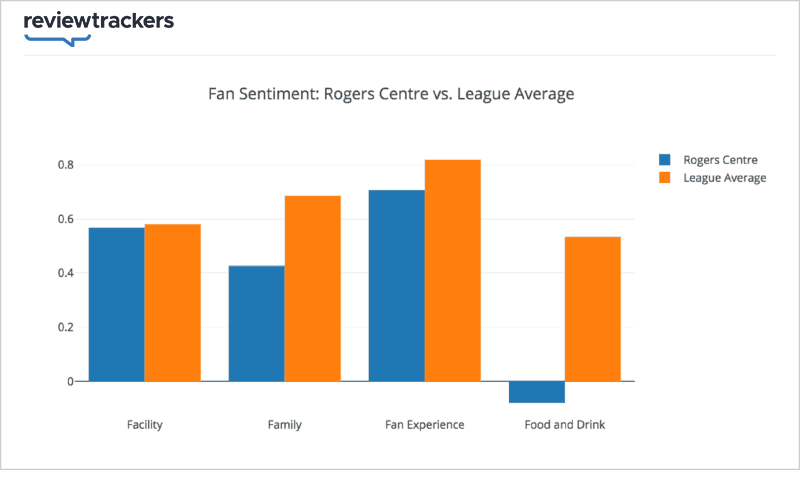
Facility rank: 20
Family rank: 29
Fan experience rank: 25
Food and drink rank: 30
Overall rank: 28
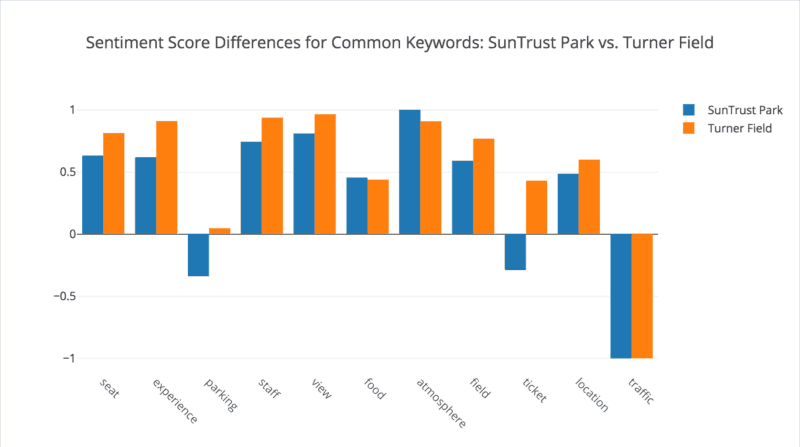
29. SunTrust Park (& Turner Field)
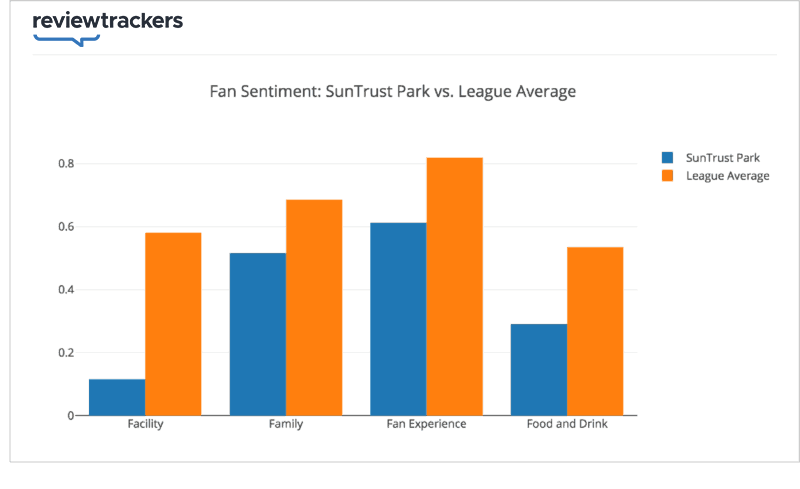
Facility rank: 28
Family rank: 25
Fan experience rank: 29
Food and drink rank: 28
Overall rank: 29
Despite being a brand new stadium, SunTrust hasn’t performed better in terms of fan sentiment than Turner Field. It’s still early in the stadium’s history, of course. The staff is still working out a few kinks.
Here’s how SunTrust compares with Turner Field in a few of the top keywords reviewers use to describe each stadium:
30. O.co Coliseum / The Oakland–Alameda County Coliseum
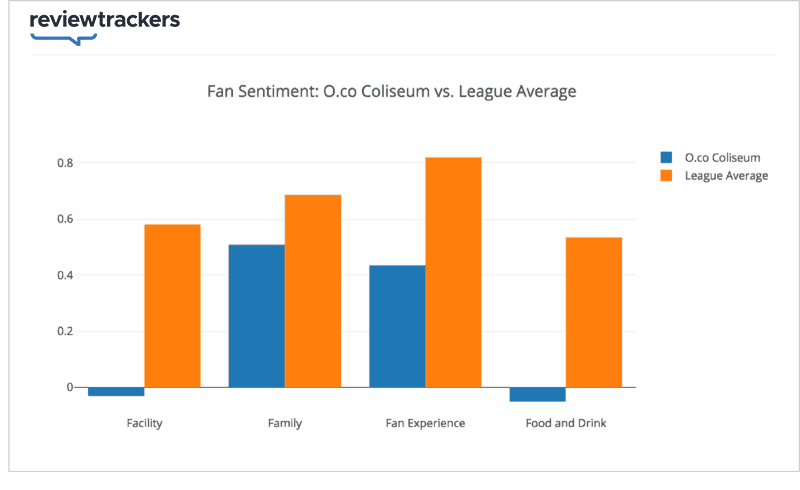
Facility rank: 30
Family rank: 26
Fan experience rank: 27
Food and drink rank: 29
Overall rank: 30
Sure, Oakland may not have the nicest bathrooms. But what it lacks in terms of cleanliness and modern design, it makes up for in nachos:
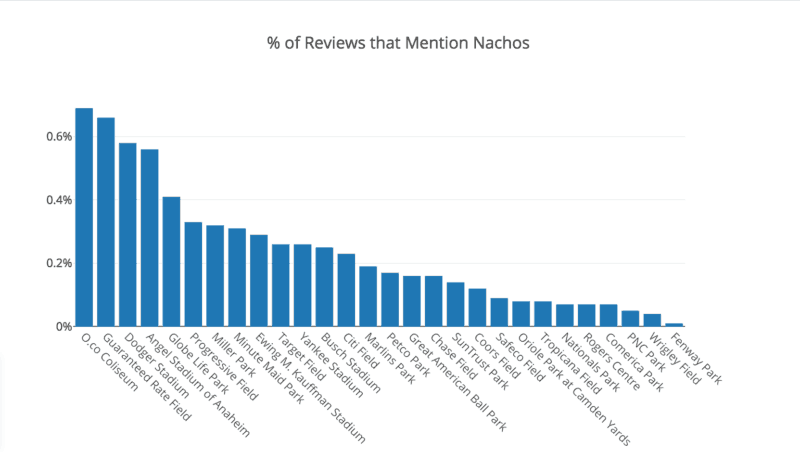
Nachos = the new market inefficiency?
Conclusion
By looking at the fan sentiment underlying stadium experiences, we can get a more nuanced understanding of the baseball stadium experience.
We notice a couple interesting points:
1. Though hot dogs are extremely popular, fans generally talk about other food like burgers and barbecue in a much more positive way.
2. Fans talk about and experience Fenway Park and Wrigley Field very differently than the other 28 stadiums, and may conflate the experience of those stadiums with the value of the franchise and the team.
3. Stadiums can find “niches” that resonate strongly with their fans. Ice cream is big in Cleveland. Barbecue rules Baltimore. The scoreboard rocks Kansas City.
4. Investing in strong family-centric promotions — like dedicating one day a week to families — will resonate among fans with kids and leave them talking about the experience.
5. Renovations at stadiums are more than cosmetic; they lead to increased appreciation among fans for a stadium’s facilities.